

1031 EXCHANGE
Real Estate Funds
Explore Replacement Properties For Your 1031 Exchange
Review illustrative and past examples of investment opportunities available through Baker 1031 Funds. Please contact your Baker 1031 Funds representative for the latest available investment opportunities.

Oil & Gas Portfolio
INVESTMENT OFFERING
11.00%
CAP RATE EQUIVALENT¹
None
ASSUMABLE FINANCING
Quarterly
DIST. FREQUENCY
10.00%
AVG. EST. DIST²

All-Cash NNN Portfolio
INVESTMENT OFFERING
8.84%
CAP RATE EQUIVALENT¹
None
ASSUMABLE FINANCING
Monthly
DIST. FREQUENCY
5.30%
AVG. EST. DIST²

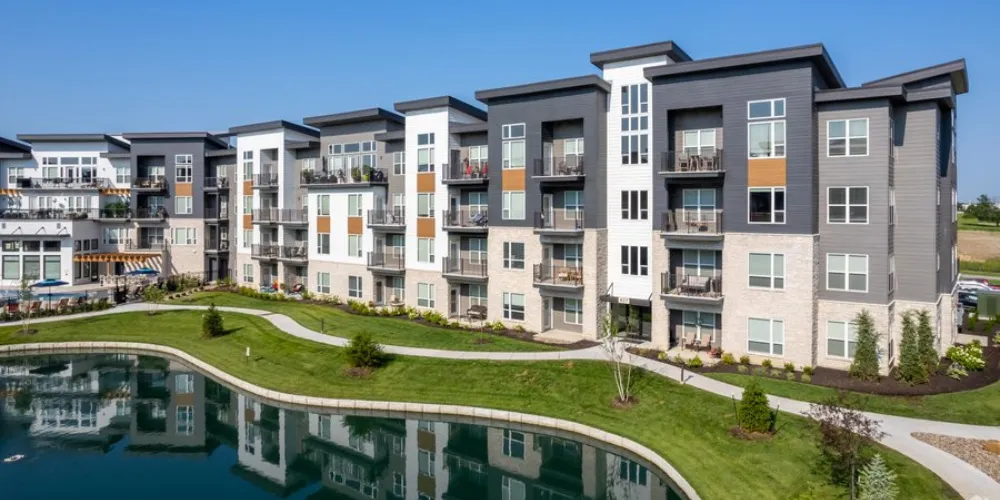
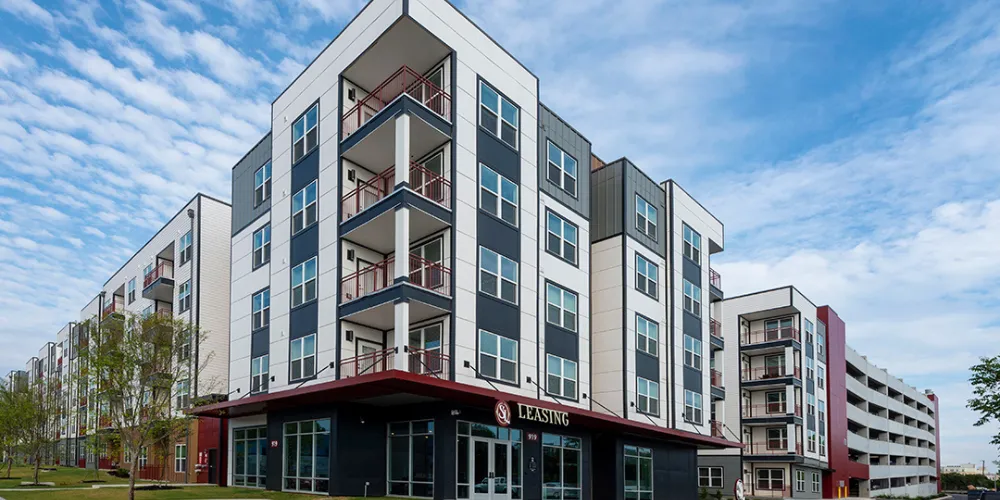
Chicago, IL Multifamily
INVESTMENT OFFERING
7.38%
CAP RATE EQUIVALENT¹
None
ASSUMABLE FINANCING
Monthly
DIST. FREQUENCY
4.46%
AVG. EST. DIST²
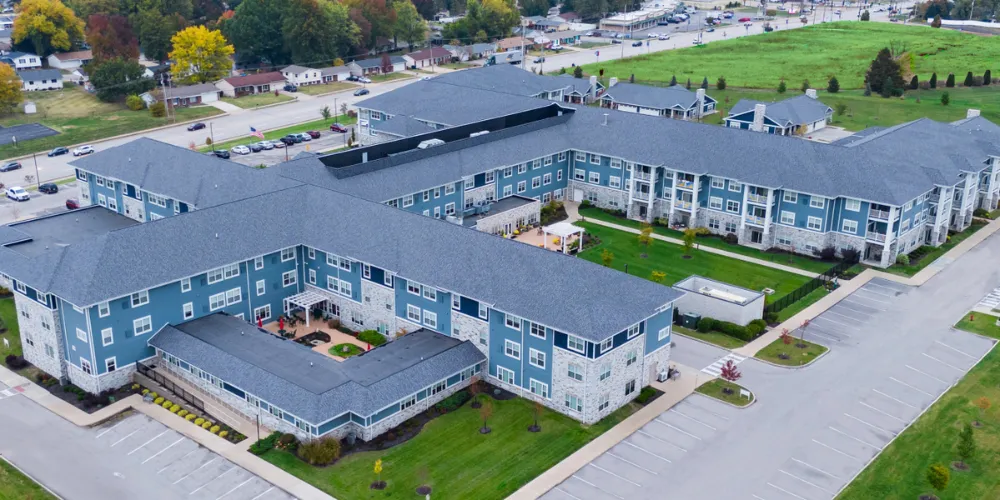
Senior Living Portfolio
INVESTMENT OFFERING
12.61%
CAP RATE EQUIVALENT¹
48.56% LTV
ASSUMABLE FINANCING
Monthly
DIST. FREQUENCY
4.50%
AVG. EST. DIST²

Orlando Hilton Hotel
INVESTMENT OFFERING
7.31%
CAP RATE EQUIVALENT¹
None
ASSUMABLE FINANCING
Monthly
DIST. FREQUENCY
6.31%
AVG. EST. DIST²
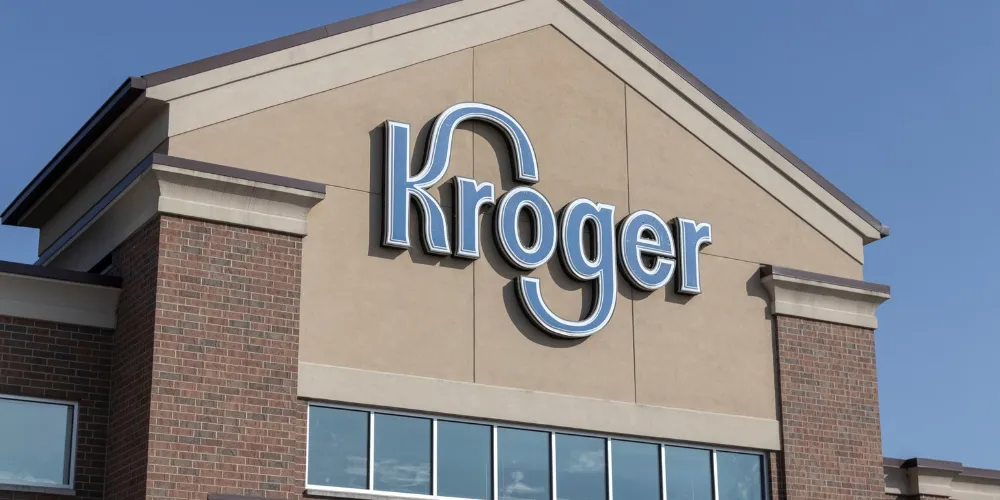
National NNN Portfolio
INVESTMENT OFFERING
10.09%
CAP RATE EQUIVALENT¹
46.57% LTV
ASSUMABLE FINANCING
Monthly
DIST. FREQUENCY
5.15%
AVG. EST. DIST²
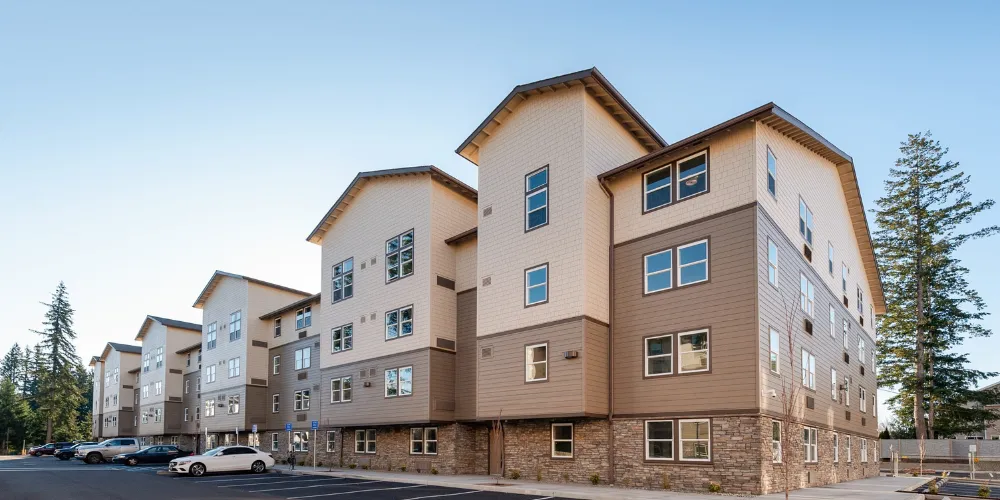
Vancouver Apartments
INVESTMENT OFFERING
11.62%
CAP RATE EQUIVALENT¹
55.00% LTV
ASSUMABLE FINANCING
Monthly
DIST. FREQUENCY
5.97%
AVG. EST. DIST²

South FL Multifamily
INVESTMENT OFFERING
11.50%
CAP RATE EQUIVALENT¹
40.99% LTV
ASSUMABLE FINANCING
Monthly
DIST. FREQUENCY
5.83%
AVG. EST. DIST²

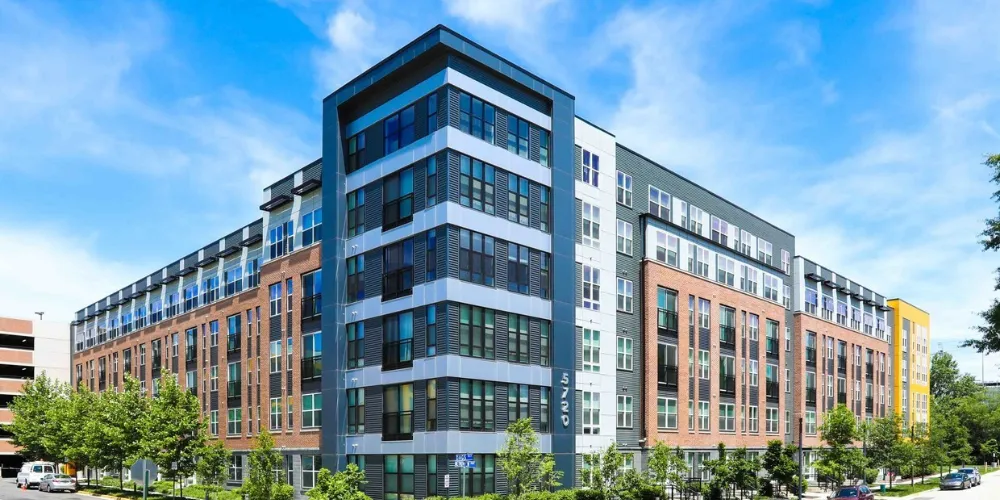
Maryland Apartments
INVESTMENT OFFERING
10.39%
CAP RATE EQUIVALENT¹
43.78% LTV
ASSUMABLE FINANCING
Monthly
DIST. FREQUENCY
5.69%
AVG. EST. DIST²
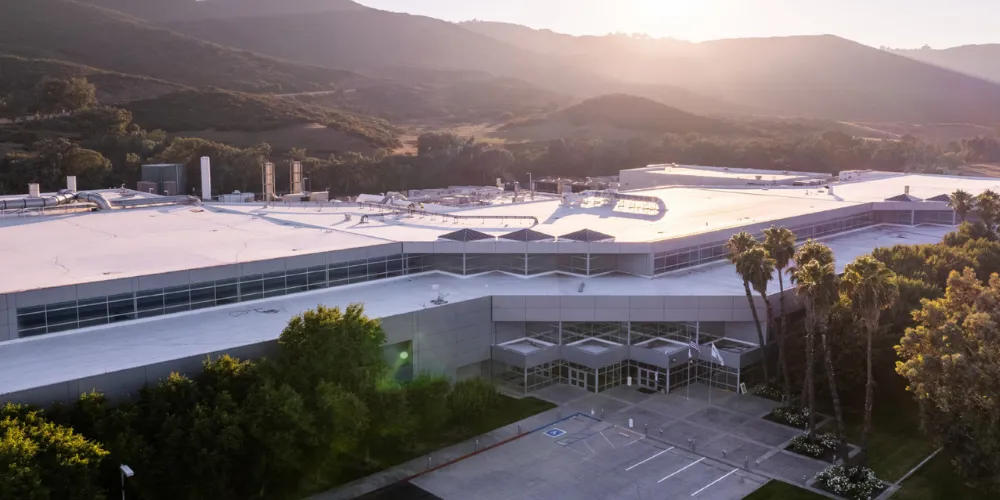
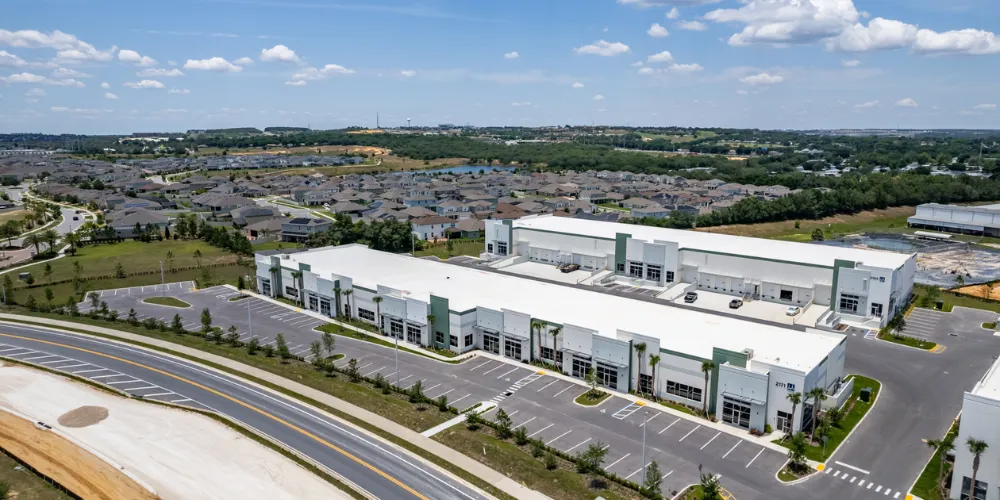
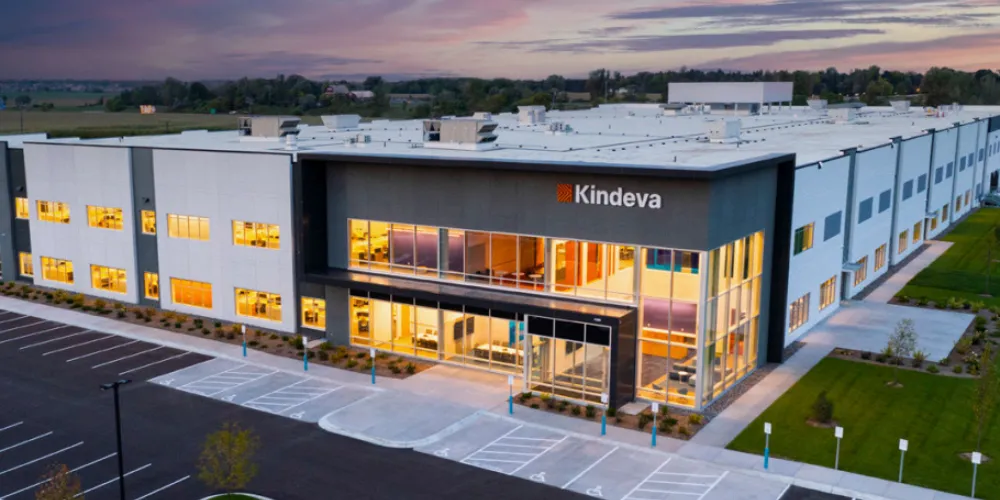
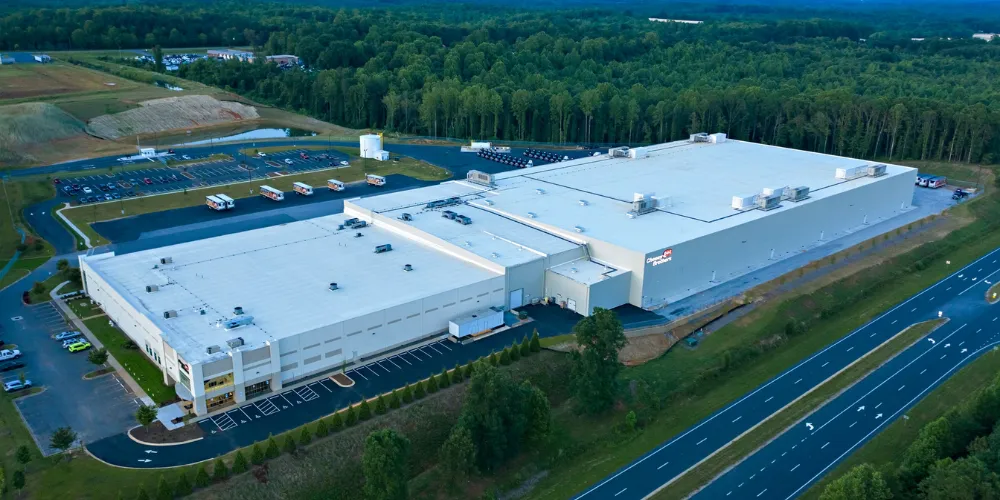
Semiconductor Facility
INVESTMENT OFFERING
11.68%
CAP RATE EQUIVALENT¹
35.00% LTV
ASSUMABLE FINANCING
Monthly
DIST. FREQUENCY
5.61%
AVG. EST. DIST²
Virginia Apartments
INVESTMENT OFFERING
10.39%
CAP RATE EQUIVALENT¹
43.78% LTV
ASSUMABLE FINANCING
Monthly
DIST. FREQUENCY
5.69%
AVG. EST. DIST²
CA Industrial Portfolio
INVESTMENT OFFERING
5.71%
CAP RATE EQUIVALENT¹
None
ASSUMABLE FINANCING
Monthly
DIST. FREQUENCY
4.71%
AVG. EST. DIST²

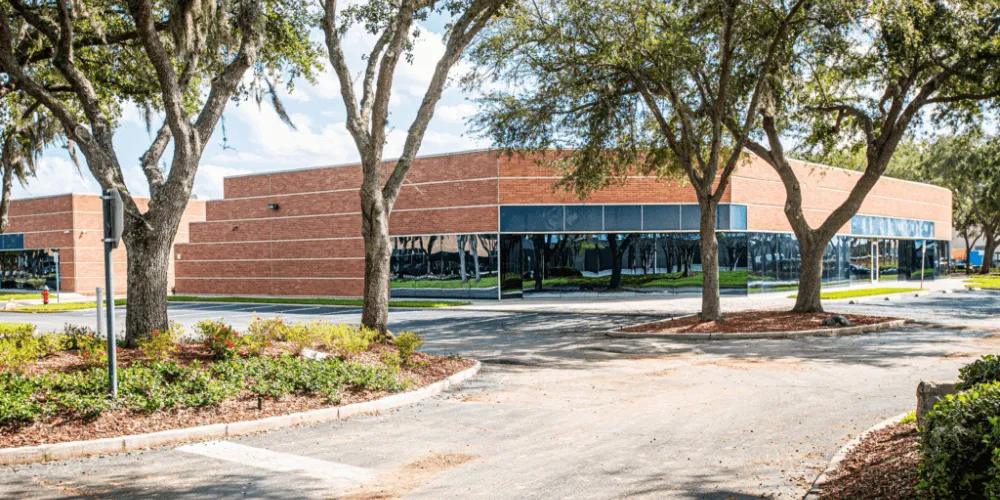
Industrial Portfolio
INVESTMENT OFFERING
5.58%
CAP RATE EQUIVALENT¹
None
ASSUMABLE FINANCING
Monthly
DIST. FREQUENCY
4.58%
AVG. EST. DIST²
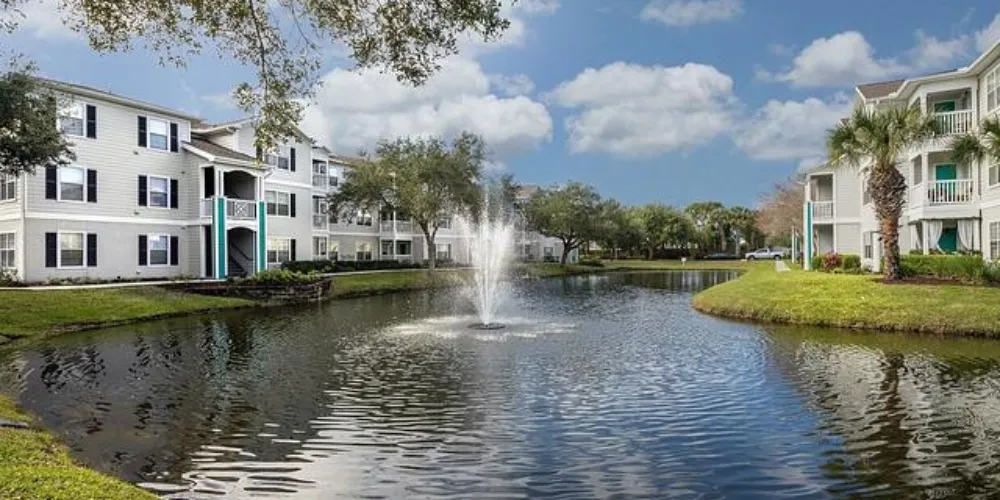
Tampa Multifamily
INVESTMENT OFFERING
9.78%
CAP RATE EQUIVALENT¹
46.17% LTV
ASSUMABLE FINANCING
Monthly
DIST. FREQUENCY
4.88%
AVG. EST. DIST²

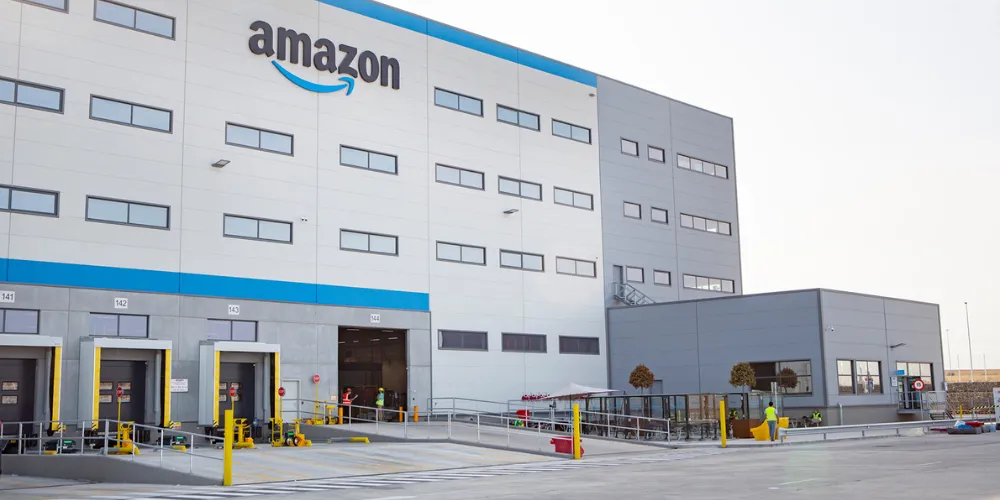
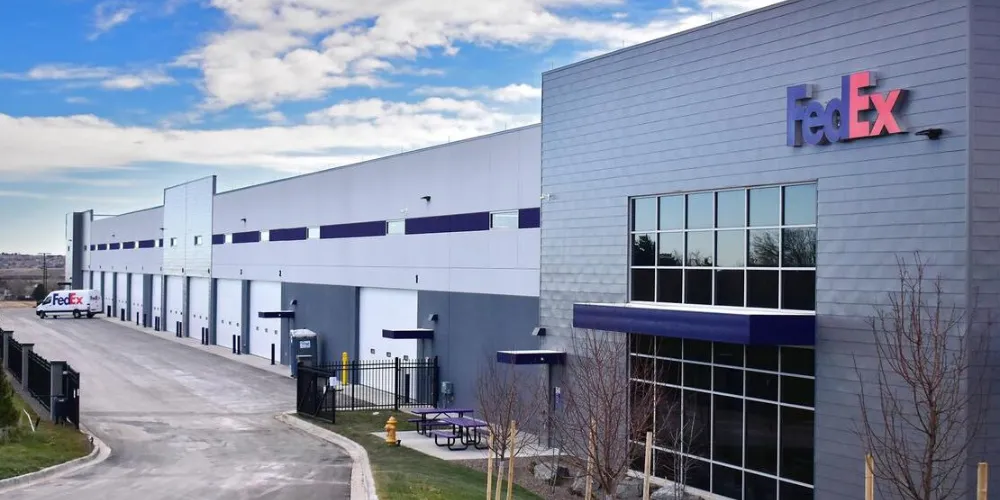
Boston Amazon
INVESTMENT OFFERING
8.18%
CAP RATE EQUIVALENT¹
84.75% LTV
ASSUMABLE FINANCING
Zero Coupon
DIST. FREQUENCY
Zero Coupon
AVG. EST. DIST²
Homeland Security
INVESTMENT OFFERING
8.25%
CAP RATE EQUIVALENT¹
22.64% LTV
ASSUMABLE FINANCING
Monthly
DIST. FREQUENCY
5.34%
AVG. EST. DIST²

Self-Storage Portfolio
INVESTMENT OFFERING
6.69%
CAP RATE EQUIVALENT¹
None
ASSUMABLE FINANCING
Monthly
DIST. FREQUENCY
5.69%
AVG. EST. DIST²
Kansas City Apartments
INVESTMENT OFFERING
10.37%
CAP RATE EQUIVALENT¹
52.69% LTV
ASSUMABLE FINANCING
Monthly
DIST. FREQUENCY
4.91%
AVG. EST. DIST²
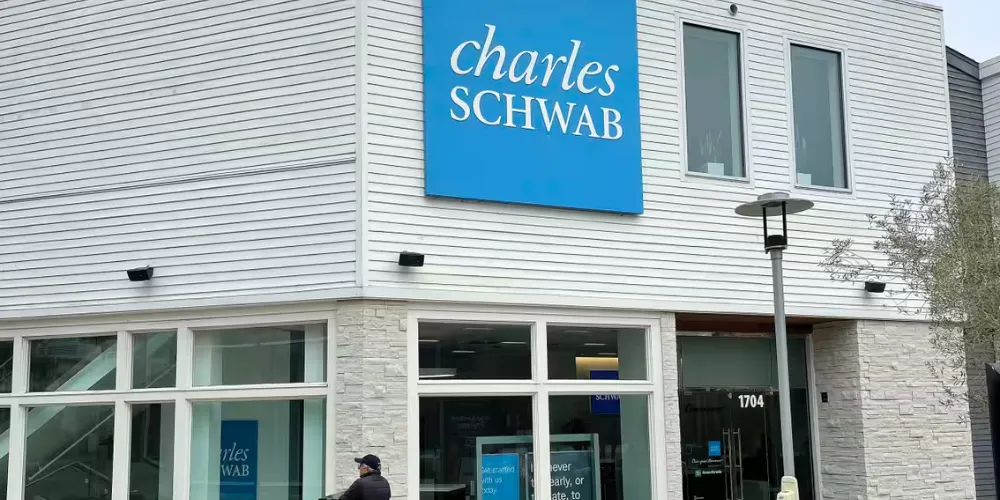
NNN Medical Portfolio
INVESTMENT OFFERING
6.00%
CAP RATE EQUIVALENT¹
None
ASSUMABLE FINANCING
Monthly
DIST. FREQUENCY
5.00%
AVG. EST. DIST²

Denver Apartments
INVESTMENT OFFERING
9.97%
CAP RATE EQUIVALENT¹
52.20% LTV
ASSUMABLE FINANCING
Monthly
DIST. FREQUENCY
4.55%
AVG. EST. DIST²
Industrial Portfolio
INVESTMENT OFFERING
9.81%
CAP RATE EQUIVALENT¹
50.52% LTV
ASSUMABLE FINANCING
Monthly
DIST. FREQUENCY
4.18%
AVG. EST. DIST²
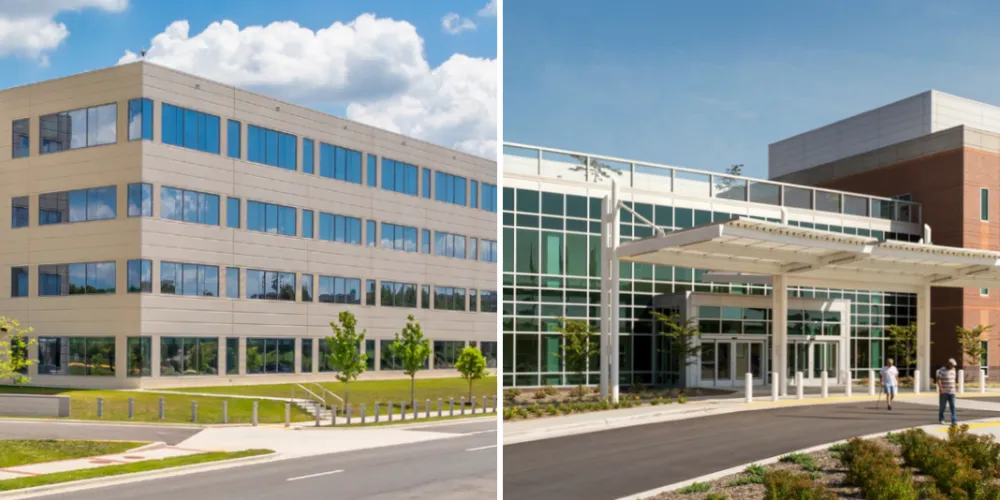
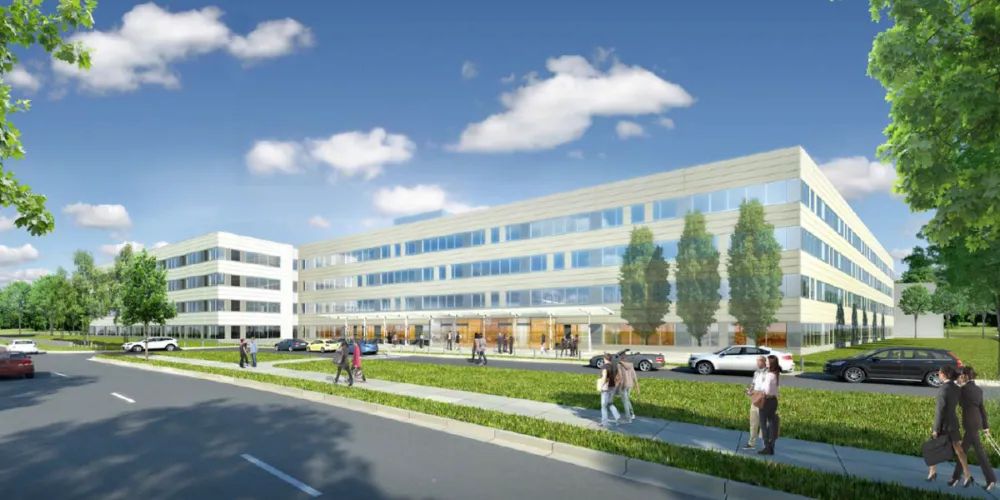
GSA Office Portfolio
INVESTMENT OFFERING
10.64%
CAP RATE EQUIVALENT¹
56.60% LTV
ASSUMABLE FINANCING
Monthly
DIST. FREQUENCY
4.85%
AVG. EST. DIST²
SC Student Housing
INVESTMENT OFFERING
7.31%
CAP RATE EQUIVALENT¹
None
ASSUMABLE FINANCING
Monthly
DIST. FREQUENCY
4.65%
AVG. EST. DIST²

Rochester Senior Living
INVESTMENT OFFERING
11.68%
CAP RATE EQUIVALENT¹
48.20% LTV
ASSUMABLE FINANCING
Monthly
DIST. FREQUENCY
6.59%
AVG. EST. DIST²
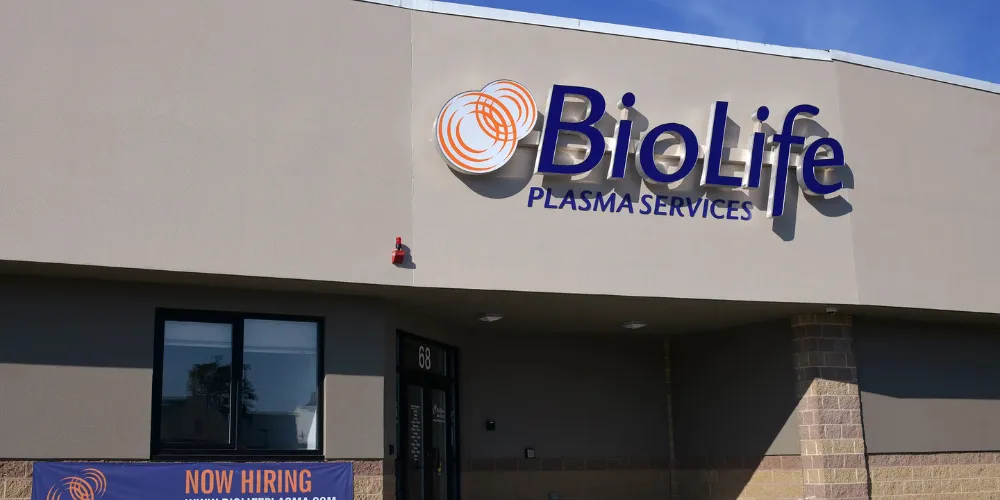
Pharma Manufacturing
INVESTMENT OFFERING
9.46%
CAP RATE EQUIVALENT¹
50.52% LTV
ASSUMABLE FINANCING
Monthly
DIST. FREQUENCY
4.18%
AVG. EST. DIST²

National DG Portfolio
INVESTMENT OFFERING
7.00%
CAP RATE EQUIVALENT¹
None
ASSUMABLE FINANCING
Monthly
DIST. FREQUENCY
6.00%
AVG. EST. DIST²
FL Industrial Portfolio
INVESTMENT OFFERING
11.50%
CAP RATE EQUIVALENT¹
49.80% LTV
ASSUMABLE FINANCING
Monthly
DIST. FREQUENCY
6.34%
AVG. EST. DIST²

Kentucky Apartments
INVESTMENT OFFERING
7.00%
CAP RATE EQUIVALENT¹
None
ASSUMABLE FINANCING
Monthly
DIST. FREQUENCY
6.00%
AVG. EST. DIST²

Self-Storage Portfolio
INVESTMENT OFFERING
5.97%
CAP RATE EQUIVALENT¹
None
ASSUMABLE FINANCING
Monthly
DIST. FREQUENCY
4.18%
AVG. EST. DIST²

Tampa Hilton Hotel
INVESTMENT OFFERING
7.46%
CAP RATE EQUIVALENT¹
None
ASSUMABLE FINANCING
Monthly
DIST. FREQUENCY
6.46%
AVG. EST. DIST²

Columbus Apartments
INVESTMENT OFFERING
11.56%
CAP RATE EQUIVALENT¹
55.13% LTV
ASSUMABLE FINANCING
Monthly
DIST. FREQUENCY
5.89%
AVG. EST. DIST²

National NNN Portfolio
INVESTMENT OFFERING
8.50%
CAP RATE EQUIVALENT¹
None
ASSUMABLE FINANCING
Monthly
DIST. FREQUENCY
5.32%
AVG. EST. DIST²

Columbus Apartments
INVESTMENT OFFERING
11.56%
CAP RATE EQUIVALENT¹
None
ASSUMABLE FINANCING
Monthly
DIST. FREQUENCY
5.26%
AVG. EST. DIST²
National NNN Portfolio
INVESTMENT OFFERING
6.27%
CAP RATE EQUIVALENT¹
None
ASSUMABLE FINANCING
Monthly
DIST. FREQUENCY
5.27%
AVG. EST. DIST²
TX Cold Storage
INVESTMENT OFFERING
5.03%
CAP RATE EQUIVALENT¹
None
ASSUMABLE FINANCING
Monthly
DIST. FREQUENCY
4.03%
AVG. EST. DIST²

Phoenix NNN Portfolio
INVESTMENT OFFERING
6.26%
CAP RATE EQUIVALENT¹
None
ASSUMABLE FINANCING
Monthly
DIST. FREQUENCY
5.26%
AVG. EST. DIST²

Industrial Portfolio
INVESTMENT OFFERING
5.71%
CAP RATE EQUIVALENT¹
None
ASSUMABLE FINANCING
Monthly
DIST. FREQUENCY
4.71%
AVG. EST. DIST²

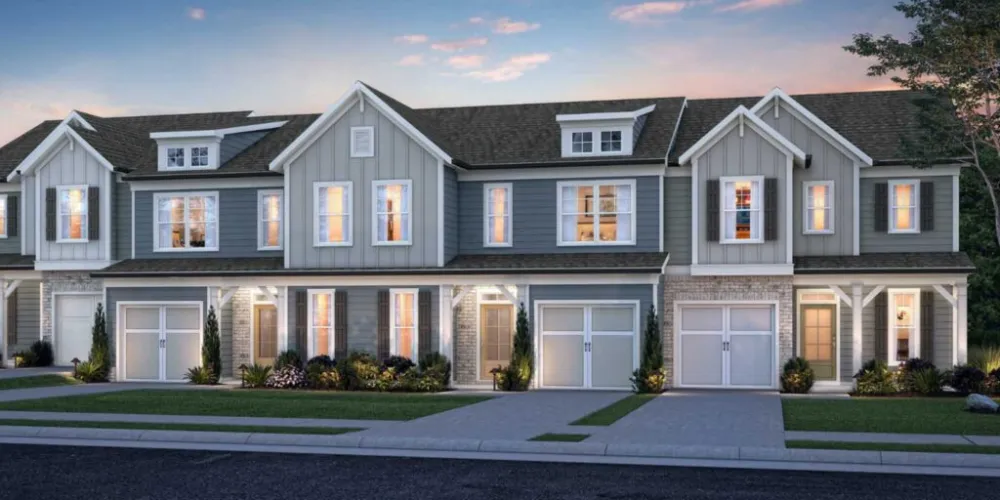
NC BFR Housing
INVESTMENT OFFERING
9.69%
CAP RATE EQUIVALENT¹
51.17% LTV
ASSUMABLE FINANCING
Monthly
DIST. FREQUENCY
4.63%
AVG. EST. DIST²

Louisville Apartment
INVESTMENT OFFERING
9.80%
CAP RATE EQUIVALENT¹
39.02% LTV
ASSUMABLE FINANCING
Monthly
DIST. FREQUENCY
5.50%
AVG. EST. DIST²
GA BFR Housing
INVESTMENT OFFERING
10.23%
CAP RATE EQUIVALENT¹
54.65% LTV
ASSUMABLE FINANCING
Monthly
DIST. FREQUENCY
4.45%
AVG. EST. DIST²
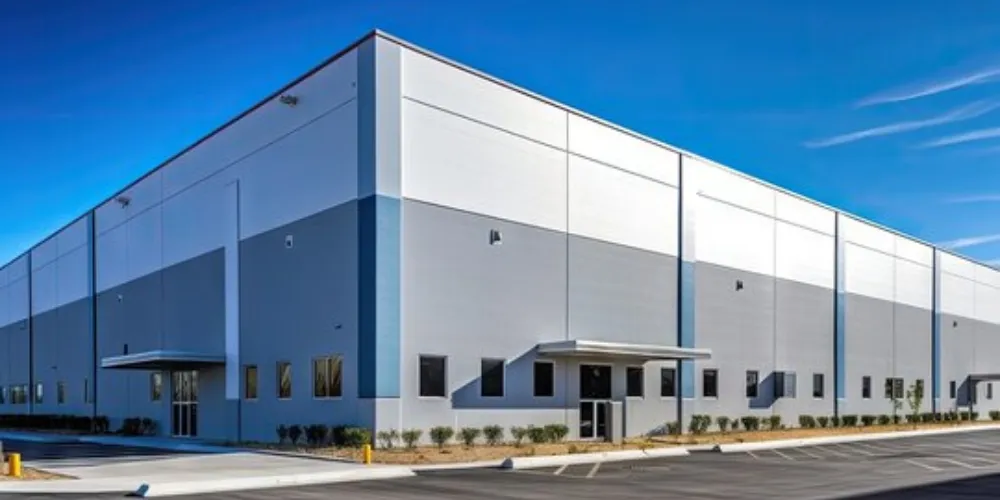
TX Industrial Portfolio
INVESTMENT OFFERING
8.99%
CAP RATE EQUIVALENT¹
30.61% LTV
ASSUMABLE FINANCING
Monthly
DIST. FREQUENCY
5.40%
AVG. EST. DIST²
National NNN Portfolio
INVESTMENT OFFERING
9.69%
CAP RATE EQUIVALENT¹
41.18% LTV
ASSUMABLE FINANCING
Monthly
DIST. FREQUENCY
5.20%
AVG. EST. DIST²

Phoenix NNN Hospital
INVESTMENT OFFERING
11.90%
CAP RATE EQUIVALENT¹
56.08% LTV
ASSUMABLE FINANCING
Monthly
DIST. FREQUENCY
6.16%
AVG. EST. DIST²

OK Oil & Gas Portfolio
INVESTMENT OFFERING
13.25%
CAP RATE EQUIVALENT¹
None
ASSUMABLE FINANCING
Quarterly
DIST. FREQUENCY
12.25%
AVG. EST. DIST²

[email protected] | +1 (844) 787-1031
Learn more about us on BrokerCheck.
The information herein has been prepared for educational purposes only and does not constitute an offer to purchase or sell securitized real estate investments. Such offers are only made through the Sponsor’s Private Placement Memorandum (PPM) which is solely available to accredited investors and accredited entities. DST 1031 properties are only available to accredited investors (generally described as having a net worth of over $1 million dollars exclusive of primary residence) and accredited entities only. If you are unsure if you are an accredited investor and/or an accredited entity, please verify with your CPA and Attorney.
There are material risks associated with investing in DST properties and real estate securities including liquidity, tenant vacancies, general market conditions and competition, lack of operating history, interest rate risks, the risk of new supply coming to market and softening rental rates, general risks of owning/operating commercial and multifamily properties, short term leases associated with multi-family properties, financing risks, potentially adverse tax consequences, general economic risks, development risks, long hold periods, and potential loss of the entire investment principal. Potential cash flows/returns/appreciation are not guaranteed and could be lower than anticipated. Diversification does not guarantee a profit or protect against a loss in a declining market. It is a method used to help manage investment risk. Because investor situations and objectives vary this information is not intended to indicate suitability for any particular investor. This material is not to be interpreted as tax or legal advice. Please speak with your own tax and legal advisors for advice/guidance regarding your particular situation.
Securities offered through Aurora Securities, Inc. (ASI), member FINRA / SIPC. Baker 1031 Investments (Baker 1031) is independent of ASI. To access Aurora Securities’ Form Customer Relationship Summary (CRS), please click HERE. Baker 1031 Investments and ASI do not offer legal or tax advice. Please consult the appropriate professional regarding your individual circumstances.
Client examples are hypothetical and for illustration purposes only. Individual results may vary.
This site is published for residents of the United States only. Representatives may only conduct business with residents of the states and jurisdictions in which they are properly registered. Therefore, a response to a request for information may be delayed until appropriate registration is obtained or exemption from registration is determined. Not all services referenced on this site are available in every state through every advisor listed.
¹Platform AUM includes all Sponsors on the Aurora Securities DST platform including: Blue Owl, Bluerock, Brookfield, Cantor Fitzgerald, Capital Square, Carter Exchange, ExchangeRight, Inland, and Invesco.
²Average Platform IRR is based on a selection of realized investments from Sponsors available on the Aurora Securities DST platform. Selection of realized investments represented was based on availability of data and removal of special situations that may affect the outcome including 721 Exchanges. Represented Sponsors include Bluerock, Capital Square, Four Springs, Net Lease Capital, and NexPoint. Past performance is not indicative of future performance.
³Average Platform Equity Multiple is based on a selection of realized investments from Sponsors available on the Aurora Securities DST platform. Selection of realized investments represented was based on availability of data and removal of special situations that may affect the outcome including 721 Exchanges. Represented Sponsors include Bluerock, Capital Square, Four Springs, Net Lease Capital, and NexPoint. Past performance is not indicative of future performance.
⁴Average Platform Holding Period is based on a selection of realized investments from Sponsors available on the Aurora Securities DST platform. Selection of realized investments represented was based on availability of data and removal of special situations that may affect the outcome including 721 Exchanges. Represented Sponsors include Bluerock, Capital Square, Four Springs, Net Lease Capital, and NexPoint. Past performance is not indicative of future performance.