

OUR 1031 EXCHANGE STRATEGIES
The Institutional Real Estate Investor Advantage
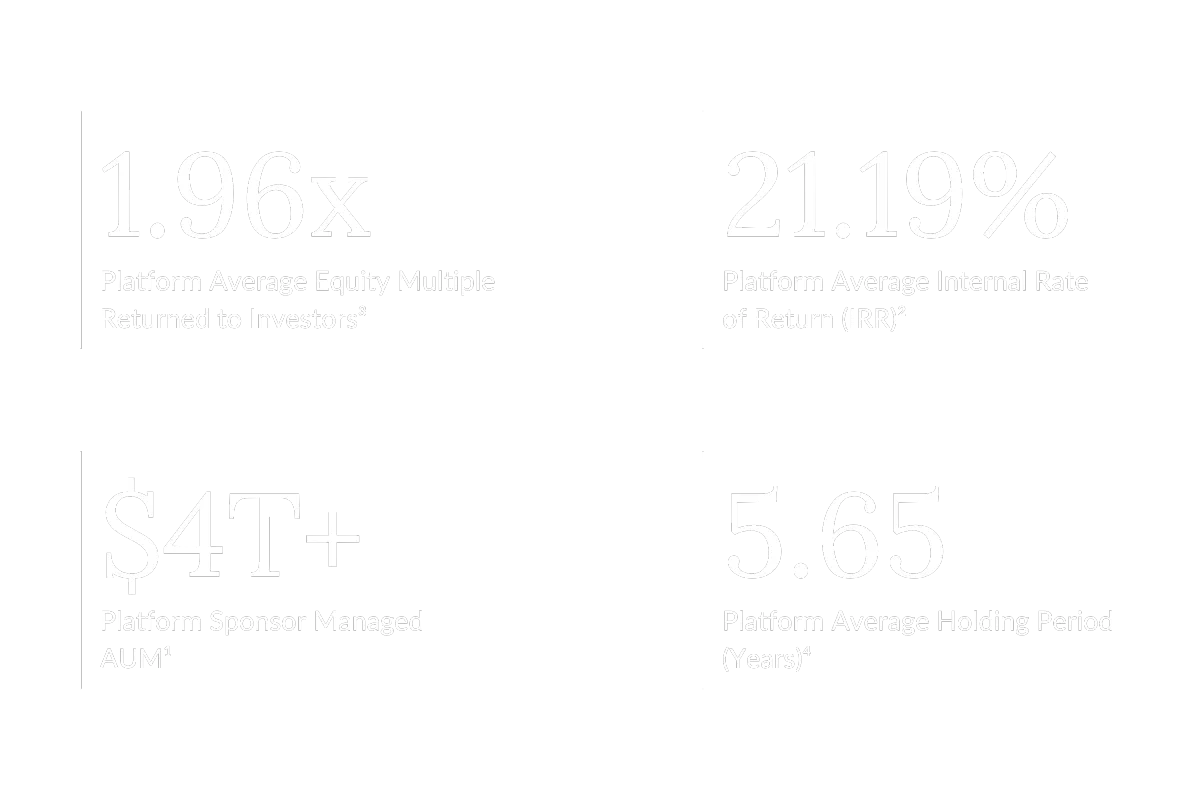
We Strategically Partner With Leading Institutions
Institutional investment funds have unique advantages over individual real estate investors. By strategically partnering with these leading, renown institutional firms, we provide individual real estate investors the ability to utilize these same advantages in their portfolio.
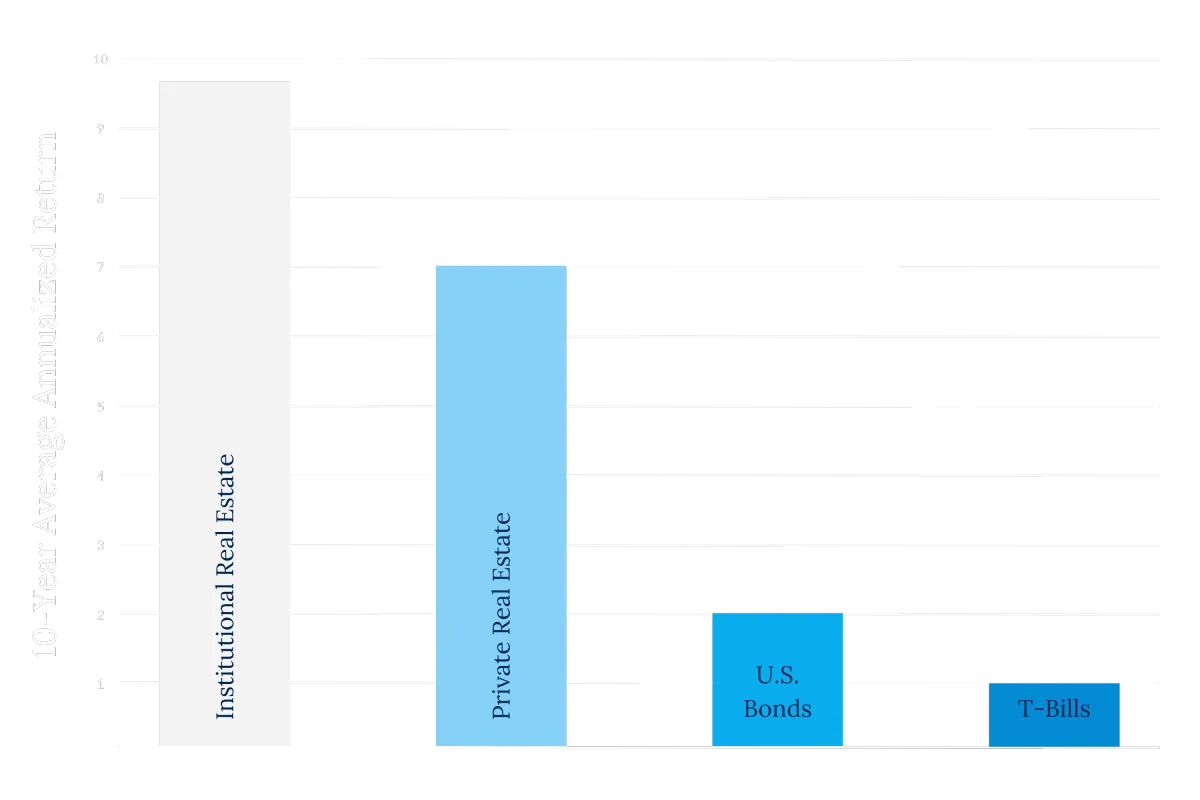
Sources: NAREIT Complete History of Annual Returns by Investment Sector and Property Sector Annual Returns by Investment Sector: 1972 - 2024. Invesco real estate with data sourced from Bloomberg L.P. and NCREIF. Based on quarterly annualized returns. Full period of returns shown begins January 1, 1995 and ends December 31, 2023. US equities represented by the S&P 500 Index. US bonds represented by the Bloomberg US Aggregate Bond Index. US real estate represented by the Classic NCREIF Property Index (from here on referred to as "NPI"). Treasury bills represented by the 3-month US Government Treasury. An investment cannot be made directly in an index. Past performance is not indicative of future results.
Institutional real estate investments outperform private real estate investors.
On average, U.S. institutional real estate has outperformed compared to the return on U.S. private real estate, US bonds, and Treasury yields over a long-term period. For the past 10 years, total returns for U.S. institutional real estate were the highest compared to returns for U.S. private real estate, U.S. bonds, and the average yield of the 3-month U.S. Treasury bill.
Learn how to use your 1031 Exchange to add institutional real estate investments to your portfolio.
Sources: NAREIT Complete History of Annual Returns by Investment Sector and Property Sector Annual Returns by Investment Sector: 1972 - 2024. Invesco real estate with data sourced from Bloomberg L.P. and NCREIF. Based on quarterly annualized returns. Full period of returns shown begins January 1, 1995 and ends December 31, 2023. US equities represented by the S&P 500 Index. US bonds represented by the Bloomberg US Aggregate Bond Index. US real estate represented by the Classic NCREIF Property Index (from here on referred to as "NPI"). Treasury bills represented by the 3-month US Government Treasury. An investment cannot be made directly in an index. Past performance is not indicative of future results.
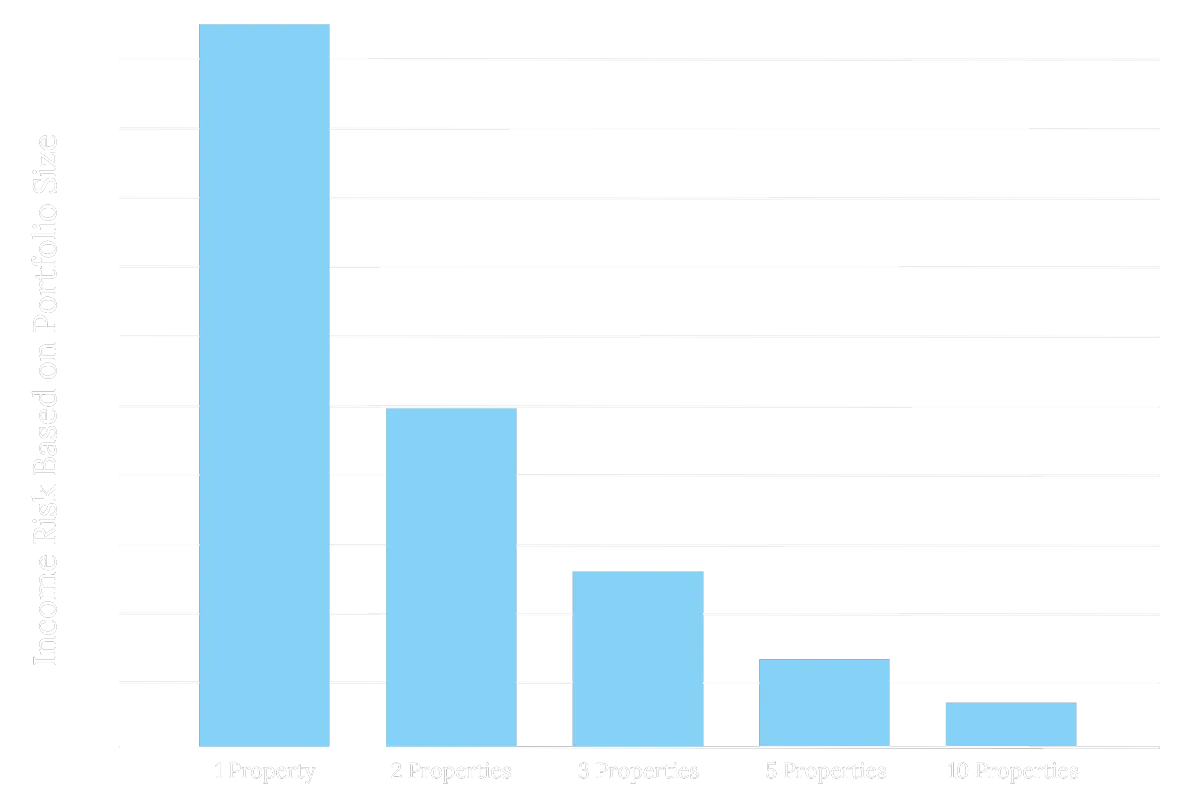
It is your income. Protect it through diversification.
Diversification is a key advantage of investing in Delaware Statutory Trusts (DSTs) for real estate investors. While traditional single-property investments offer stability, with the average investment-grade NNN property having a 2.7% default rate annually, DSTs allow investors to reduce risk by spreading their capital across multiple properties. By investing in DSTs, you can own a share of a diversified portfolio of properties, significantly lowering the impact of any potential losses from a single asset. With our strategies, investors can use the same amount of funds typically spent on one property to gain exposure to several, including larger, higher-value assets that may have been otherwise out of reach for individual investors. This approach enhances both risk management and the potential for income and appreciation.
Start exploring your options for building a diversified, institutional-quality real estate portfolio.
Source: Percentage of defaults by issuers rated by Standard and Poor’s over the past fifteen years based on the rating they were initially assigned. Source: Standard and Poor’s Corp/Business Week, 2002. Chart not to scale.
Source: Percentage of defaults by issuers rated by Standard and Poor’s over the past fifteen years based on the rating they were initially assigned. Source: Standard and Poor’s Corp/Business Week, 2002. Chart not to scale.
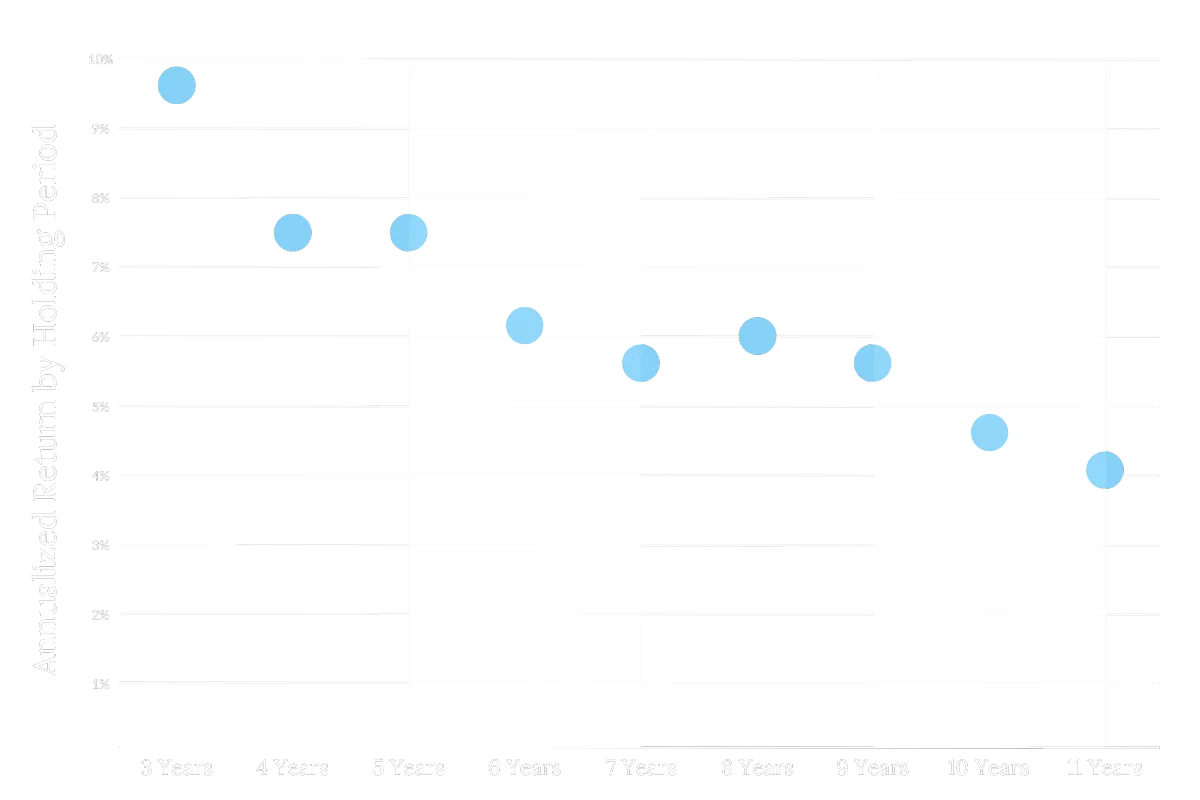
Sources: Average holding periods per Harvard University: Understanding Time Horizons of Alternative Investments. Return for each holding period per The Characteristics of Commercial Real Estate Holding Period Returns at Indiana University.
Institutional real estate investors time the market better than individuals.
Institutional real estate investors are better at timing markets due to their access to larger capital, data-driven analysis, and expert teams. They make more informed decisions compared to individual investors, who often rely on intuition. Additionally, investments held for less than three years may not qualify for 1031 Exchanges, which incentivizes longer-term holdings. While institutional investors focus on market cycles, individual investors typically hold properties for nine or more years to benefit from long-term appreciation and rental income, often due to personal financial goals and smaller capital.
Access available opportunities for your next 1031 Exchange.
Sources: Average holding periods per Harvard University: Understanding Time Horizons of Alternative Investments. Return for each holding period per The Characteristics of Commercial Real Estate Holding Period Returns at Indiana University.

[email protected] | +1 (844) 787-1031
Learn more about us on BrokerCheck.
The information herein has been prepared for educational purposes only and does not constitute an offer to purchase or sell securitized real estate investments. Such offers are only made through the Sponsor’s Private Placement Memorandum (PPM) which is solely available to accredited investors and accredited entities. DST 1031 properties are only available to accredited investors (generally described as having a net worth of over $1 million dollars exclusive of primary residence) and accredited entities only. If you are unsure if you are an accredited investor and/or an accredited entity, please verify with your CPA and Attorney.
There are material risks associated with investing in DST properties and real estate securities including liquidity, tenant vacancies, general market conditions and competition, lack of operating history, interest rate risks, the risk of new supply coming to market and softening rental rates, general risks of owning/operating commercial and multifamily properties, short term leases associated with multi-family properties, financing risks, potentially adverse tax consequences, general economic risks, development risks, long hold periods, and potential loss of the entire investment principal. Potential cash flows/returns/appreciation are not guaranteed and could be lower than anticipated. Diversification does not guarantee a profit or protect against a loss in a declining market. It is a method used to help manage investment risk. Because investor situations and objectives vary this information is not intended to indicate suitability for any particular investor. This material is not to be interpreted as tax or legal advice. Please speak with your own tax and legal advisors for advice/guidance regarding your particular situation.
Securities offered through Aurora Securities, Inc. (ASI), member FINRA / SIPC. Baker 1031 Investments (Baker 1031) is independent of ASI. To access Aurora Securities’ Form Customer Relationship Summary (CRS), please click HERE. Baker 1031 Investments and ASI do not offer legal or tax advice. Please consult the appropriate professional regarding your individual circumstances.
Client examples are hypothetical and for illustration purposes only. Individual results may vary.
This site is published for residents of the United States only. Representatives may only conduct business with residents of the states and jurisdictions in which they are properly registered. Therefore, a response to a request for information may be delayed until appropriate registration is obtained or exemption from registration is determined. Not all services referenced on this site are available in every state through every advisor listed.
¹Platform AUM includes all Sponsors on the Aurora Securities DST platform including: Blue Owl, Bluerock, Brookfield, Cantor Fitzgerald, Capital Square, Carter Exchange, ExchangeRight, Inland, and Invesco.
²Average Platform IRR is based on a selection of realized investments from Sponsors available on the Aurora Securities DST platform. Selection of realized investments represented was based on availability of data and removal of special situations that may affect the outcome including 721 Exchanges. Represented Sponsors include Bluerock, Capital Square, Four Springs, Net Lease Capital, and NexPoint. Past performance is not indicative of future performance.
³Average Platform Equity Multiple is based on a selection of realized investments from Sponsors available on the Aurora Securities DST platform. Selection of realized investments represented was based on availability of data and removal of special situations that may affect the outcome including 721 Exchanges. Represented Sponsors include Bluerock, Capital Square, Four Springs, Net Lease Capital, and NexPoint. Past performance is not indicative of future performance.
⁴Average Platform Holding Period is based on a selection of realized investments from Sponsors available on the Aurora Securities DST platform. Selection of realized investments represented was based on availability of data and removal of special situations that may affect the outcome including 721 Exchanges. Represented Sponsors include Bluerock, Capital Square, Four Springs, Net Lease Capital, and NexPoint. Past performance is not indicative of future performance.