AX Essential Retail Portfolio DST Overview
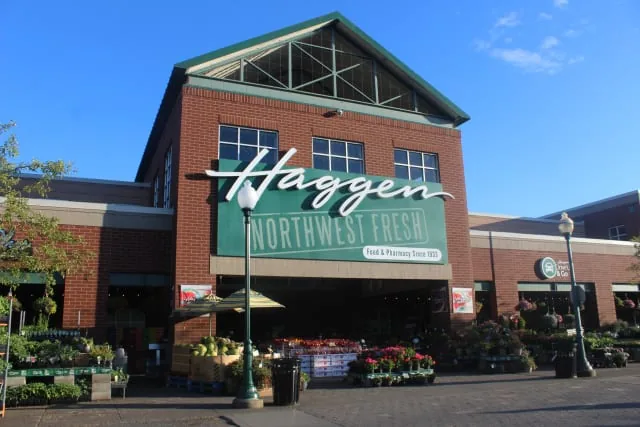
AX Essential Retail Portfolio, DST, sponsored by Apollo through its Apollo Real Estate Exchange (AX) platform, is a debt-free, all-cash offering of $91,520,000 of Class 1 interests (100% equity, no leverage) in four standalone grocery stores totaling 248,103 net rentable square feet on ~39.0 acres with 1,458 parking spaces, located along the supply-constrained North Puget Sound / Interstate-5 corridor north of Seattle: Ferndale (1997; 60,835 SF), Burlington (2001; 63,500 SF), Stanwood (1995; 60,168 SF), and Mount Vernon (2000; 63,600 SF), Washington. All four assets are leased on an absolute-net basis to Safeway Inc. doing business as Haggen, a Pacific Northwest grocery banner and wholly owned subsidiary of Albertsons Companies, Inc. (NYSE: ACI), under 240-month (20-year) leases with multiple five-year extension options and a ~10-year weighted-average remaining term (Mount Vernon expiring December 6, 2034). The Trust acquired the Properties for $84,400,000 against a $91,520,000 offering, and leases them to an affiliated Master Tenant (AX Essential Retail Portfolio LeaseCo, LLC) capitalized by a non-interest-bearing $2,864,000 demand note from an Apollo affiliate. The portfolio represents ~25% of Haggen's regional sales, with three of four stores in the top foot-traffic quartile and ~4.2 million annual visits (TTM August 2025). The Business Plan targets monthly distributions rising from 4.3% to 5.2% over an approximately seven-to-ten-year hold, with an optional Section 721 / FMV exchange into an Apollo operating partnership exercisable after the two-year minimum hold; securities offered through Apollo Global Securities, LLC and Griffin Capital Securities, LLC.
Highlights
All four assets are leased on an absolute-net basis to Safeway Inc. doing business as Haggen, a wholly owned subsidiary of Albertsons Companies, Inc. (NYSE: ACI), one of the largest food-and-drug retailers in North America, removing landlord responsibility for taxes, insurance, maintenance, and structural obligations. The original leases run 240 months (20 years) with multiple five-year extension options and a ~10-year weighted-average remaining term, providing long-dated, needs-based income from a grocery operator that benefits from Albertsons' national scale, private-label programs, centralized distribution, and omnichannel platform (Drive Up & Go, delivery, and Instacart/DoorDash/Uber/Grubhub partnerships).
The portfolio is mission-critical to the tenant's regional operations: it represents approximately 25% of Haggen's regional sales, with three of the four stores ranking in the top quartile for foot traffic and generating roughly 4.2 million annual visits for the trailing twelve months ended August 2025. This sales productivity and customer loyalty support a low rent-to-sales burden and reinforce the durability of an absolute-net income stream anchored to established suburban trade areas.
The North Puget Sound / Interstate-5 corridor (Whatcom, Skagit, and Snohomish Counties) is among the tightest retail markets in the Pacific Northwest, with average vacancy of roughly 2.5% to 3.5% and less than 0.2% of inventory under construction; since 2020 more than 1.6 million square feet of retail has been removed through mixed-use conversion, one of the fastest inventory contractions nationally. Paired with a high-income, employment-diversified region anchored by Amazon, Microsoft, Boeing, and Costco demand, these dynamics create high barriers to entry and support long-term occupancy stability and rent durability for essential, needs-based retail.
The offering is entirely unleveraged: the Properties are owned free and clear with no mortgage financing, eliminating refinancing, interest-rate, balloon-maturity, and lender-foreclosure risk and removing any Section 1031 requirement to replace debt at the investor level. The all-cash structure positions the asset as a stabilized current-income vehicle whose distributions (projected at 4.3% rising to 5.2%) are a direct function of in-place net rent and contractual escalations rather than financial leverage.
The Sponsor is Apollo, a global alternative asset manager with approximately $908 billion of assets under management (as of September 30, 2025) investing across yield, hybrid, and equity strategies, with the offering originated through its net-lease platform and the Apollo Real Estate Exchange (AX) program. The structure includes an optional Section 721 / FMV exchange, exercisable by an Apollo operating partnership after the two-year minimum hold, offering a potential tax-deferred path to convert DST interests into operating-partnership units.
Analysis of AX Essential Retail Portfolio DST
Insights
We read this as a fixed-income substitute dressed as real estate: an all-cash, single-credit grocery net-lease DST for a 1031 portfolio's bond-proxy sleeve, not its growth sleeve. Debt-free capitalization is the thesis — no mortgage means no refinancing, rate, or balloon risk, but no leverage to lift return, so the result rides on one operator's rent, escalations, and exit pricing over a seven-to-ten-year hold. It is honestly priced but thin: the 4.3%-to-5.2% schedule screens Below Average on all three benchmark axes — income versus a ~5.1% net-lease average, peak versus ~5.3%, growth versus ~7.5% — so the buyer pays up for credit at a below-market coupon. The ~8.5% load is heavy for a yield this low; it buys Apollo's ~$908B-AUM sponsorship and an absolute-net lease. A correction to the usual all-cash worry: the Year-1 payout is covered by property NOI at 1.23x, so this sub-5% yield is earned from in-place rent, not a return of capital. The crux is concentration versus quality: every income dollar runs through one regional banner, Safeway/Haggen, across four Washington stores, and distributions flow through a master tenant funded only by a non-interest-bearing $2,864,000 demand note from an Apollo affiliate that need not add capital and can defer rent. So Albertsons/Haggen credit and Apollo's willingness to backstop that master tenant decide the deal. The point marketing buries: the real estate carries a ~6.9% cap-rate equivalent while investors collect ~4.3% in cash, because the $91.52M offering sits about 8% above the $84.4M basis — that markup is the spread you finance, leaving exit value dependent on stable-to-tighter caps, not income growth. Net: own it as a conservative exchanger who wants no-leverage, credit-tenant mailbox money and will trade yield and growth to erase financing risk; pass if you want diversification, income growth, or leverage-driven upside.
Advantages
On a micro level, the offering pairs long-dated, absolute-net income from a grocery-anchored, needs-based portfolio with a tenant affiliated to investment-grade Albertsons (NYSE: ACI) in Safeway/Haggen, carrying a ~10-year weighted-average remaining lease term, 20-year original terms, and multiple five-year extension options. The four stores are economically critical to the operator (roughly 25% of Haggen's regional sales and three of four in the top foot-traffic quartile at ~4.2 million annual visits), implying a sustainable rent-to-sales burden and renewal optionality, and the North Puget Sound corridor is structurally supply-constrained (2.5% to 3.5% vacancy, sub-0.2% under construction, and 1.6 million SF removed since 2020) within a high-income economy anchored by major Seattle-area employers. On a macro and structural level, the all-cash, debt-free capitalization removes interest-rate, refinancing, and balloon risk entirely and delivers a clean current-income profile (4.3% rising to 5.2%, 4.75% average, partially tax-deferred through depreciation), backed by a global institutional sponsor in Apollo and an optional Section 721 exit pathway.
Concerns
Asset-specific vulnerabilities concentrate in single-tenant credit, geographic and brand concentration, and rent-coverage mechanics rather than leverage. Every dollar of income derives from one operator (Safeway/Haggen) across four stores in a single Washington sub-region, so a Haggen banner contraction, store closure, or Albertsons portfolio rationalization would impair the entire income stream with little diversification to absorb it; the Haggen banner is a regional operator rather than the broader Albertsons parent, and investors should examine the precise lease-guaranty structure. Distributions flow through an affiliated Master Tenant capitalized only by a non-interest-bearing $2,864,000 demand note from an Apollo affiliate that is under no obligation to contribute further capital, leaving the Master Tenant with limited independent net worth and a contractual right to defer a portion of rent. Escalations are defined and modest rather than aggressive, capping internal rent growth, while the ~10-year remaining lease term places both extension/re-leasing negotiations and the eventual disposition within a window exposed to grocery-sector and pricing shifts; the 1995-to-2001 building vintages may also carry capital and functional-obsolescence considerations over a longer hold.
AX Essential Retail Portfolio DST — Complete Offering Data
Offering & Structure
Investment NameAX Essential Retail Portfolio DST
SponsorApollo Global Management
StructureDelaware Statutory Trust (DST)
Offering Type506(b)
StatusClosed
Last Updated2026-08-05
Size & Availability
Total Offering$91,520,000
Equity$91,520,000
DebtAll-Cash
Available Equity$0 (0% of equity)
Minimum Investment$250,000
Total Load8.50%
Initial Reserves0.08%
Property
Property TypeNet Lease
StrategyCore
LocationWA
Market TierTier 3
Income & Projections
Average Yield4.35%
Projected Yields (Y1–Y10)Y1 4.30% · Y2 4.40%
Tax-Adjusted Yield5.70%
Cap Rate Equivalent6.89%
Year 1 NOI$4,852,003
Y1 Payout Ratio1.23
Financing
In-Place LTV0.00% LTV
LenderNone (debt-free)
Interest RateN/A (no debt)
Loan TermN/A (no debt)
I/O PeriodN/A (no debt)
AmortizationN/A (no debt)
Y1 DSCRN/A - no debt service
Exit
Estimated Hold Period2 years
721 Exchange ExitOptional
Benchmarks (vs sector median)
Avg. Income4.35% vs 5.10% market — Below Average
Growth2.33% vs 7.54% market — Below Average
Peak4.40% vs 5.33% market — Below Average
Every data point Baker 1031 tracks for this offering, in one place. Figures are drawn from the offering’s private placement memorandum and sponsor materials unless noted, are summaries for convenience only, and are qualified in their entirety by the PPM. Tap the ⓘ icon next to any label for what it means and how it is calculated.