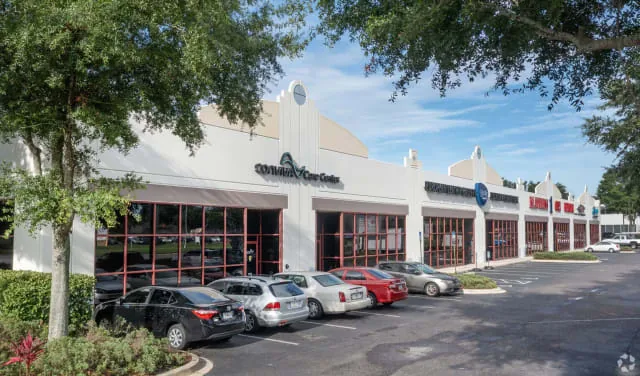
BR Diversified Industrial Portfolio 8, DST Overview
BR Diversified Industrial Portfolio 8, DST is a Regulation D, Rule 506(c) private placement offering up to $58,423,431 of Class 1 beneficial interests in a newly formed Delaware statutory trust, structured for accredited investors completing a Section 1031 exchange. The Trust owns a five-property, single-tenant industrial portfolio of roughly 463,800 net rentable square feet leased to four tenants: two office/warehouse buildings at 11732 and 11744 Beach Boulevard in Jacksonville, Florida, leased to employee-owned remodeler Woodsman Kitchens & Floors; the Chaddick Property, a distribution warehouse at 995 Chaddick Drive in Wheeling, Illinois (Chicago metro), leased to audio-equipment manufacturer Shure Inc.; the Piper Property, a distribution warehouse with industrial outdoor storage at 9400 Piper Road in Punta Gorda, Florida, leased to plumbing and HVAC distributor Hajoca Corporation; and the Warren Property, a 235,335-square-foot warehouse with outdoor storage at 1727 Warren Street in Kansas City, Missouri, leased to BlueLinx Corporation (NYSE: BXC). The Trust acquired the properties for an aggregate real estate purchase price of $47,427,394, and the offering is capitalized all-cash with no mortgage debt. The properties are held under long-term absolute and triple-net leases with a weighted average remaining term of nearly 13 years and contractual annual rent escalations averaging more than 2.5%. The Sponsor is BIGR Exchange 8 TRS, LLC, a taxable REIT subsidiary of Bluerock Industrial Growth REIT (BIGR), with advisory services from Bluerock Value Exchange (BVEX). A Bluerock affiliate master-leases the portfolio, subleases to the industrial tenants, and provides institutional property management. The offering targets monthly distributions beginning at 4.86% annualized in 2026, a projected seven-to-ten-year hold, and a potential exit through sale or a Section 721 UPREIT contribution under the Sponsor's FMV Option. It suits accredited 1031 exchangers seeking passive, debt-free industrial exposure with the potential for partially tax-deferred income and an operating-partnership exit path, who can accept illiquidity and single-tenant concentration.
Highlights
The portfolio is deliberately spread across high-demand Sunbelt and industrial-corridor markets rather than a single metro, reducing exposure to any one local economy. The two Beach Boulevard buildings sit in Jacksonville, Florida along Route 90 beside the Interstate 295 beltway, giving direct access to the full Jacksonville metro and to Interstate 95, the primary north-south freight artery of the U.S. East Coast. The Chaddick Property is in Wheeling, Illinois within the Chicago metro, one of the nation's largest distribution hubs; the Warren Property anchors Kansas City, Missouri, a central logistics crossroads; and the Piper Property serves the growing Punta Gorda / Southwest Florida market. According to CoStar data cited in the Memorandum, in-place rents are approximately 20% below current submarket levels, and the submarkets are projected to see cumulative market rent growth of roughly 15% through 2030, supporting the Sponsor's case for embedded upside as leases mark to market over the hold.
The five assets are all single-tenant industrial buildings on long-term absolute and triple-net leases with a weighted average remaining term of nearly 13 years, and the Property Condition Assessments by GRS Group rated every property in good overall condition. The rent roll blends credit quality across publicly traded, privately held, global, and national tenants: BlueLinx Corporation (NYSE: BXC), a building-products distributor serving all 50 states with roughly $2.95 billion in fiscal revenue, anchors the 235,335-square-foot Warren Property; Shure Inc., a globally recognized audio-equipment maker, occupies the 99,904-square-foot Chaddick Property; Hajoca Corporation, a plumbing and HVAC distributor founded in 1858 with 450-plus locations, leases the Piper Property; and employee-owned Woodsman Kitchens & Floors occupies both Beach Boulevard buildings. The Piper and Warren properties include highly coveted industrial outdoor storage, a scarce feature that can command a demand premium. The portfolio was acquired for $822,606 below its aggregate 'As-Is' appraised value of $48,250,000.
The offering is capitalized entirely with equity and carries no mortgage financing. Because the Trust acquired the properties free and clear, there is no loan-to-value ratio, no lender covenants, no interest-rate or refinancing exposure, and no balloon maturity or foreclosure risk that could wipe out investor equity mid-hold, an important distinction from leveraged DST programs. The Trust acquired the real estate for an aggregate $47,427,394 and is offering up to $58,423,431 of interests, with the difference funding acquisition fees, organization and offering costs, selling commissions, and reserves. It establishes a $2,000,000 Supplemental Trust Reserve plus a $100,000 Trust operating account from offering proceeds. The absolute and triple-net lease structure pushes most operating expenses, taxes, insurance, and the bulk of capital repairs onto the tenants, further limiting cash-flow variability during the projected seven-to-ten-year hold. A disposition fee of 3.5% of gross sale proceeds applies at exit (waived if the FMV Option is exercised).
The Offering is sponsored by BIGR Exchange 8 TRS, LLC, an indirect taxable REIT subsidiary of Bluerock Industrial Growth REIT, Inc. (BIGR), with advisory services provided by Bluerock Value Exchange, LLC (BVEX), a national sponsor of syndicated Section 1031 exchange offerings focused on residential and industrial real estate. As of December 31, 2025, BIGR reported gross asset value of more than $590 million across controlling and non-controlling interests in 46 properties totaling nearly 4.8 million square feet. The Memorandum states that Bluerock principals collectively have over 100 years of investing experience and more than $120 billion in real estate and capital-markets experience, with roughly $20 billion in acquired and managed assets across public and private investment programs. Bluerock Industrial Manager, LLC serves as property manager, Bluerock Capital Markets, LLC (a FINRA member) is the managing broker-dealer, and CSC Delaware Trust Company acts as the independent Delaware trustee. BR DIP 8 DST Manager, LLC manages the Trust.
The offering is designed as Section 1031 replacement property: tax counsel has provided an opinion that a purchase of Interests should be treated as a direct acquisition of the underlying real estate for Section 1031 purposes, and the Trust is structured to comply with the DST parameters of IRS Revenue Ruling 2004-86. Investors may defer federal and state capital-gains tax on the sale of relinquished property, and projected monthly distributions are expected to be partially tax-deferred as a result of depreciation and amortization. The structure adds a built-in exit option: the Operating Partnership holds an FMV Option to acquire the Interests in exchange for Class A-4 OP Units under Section 721 of the Code, accompanied by a tax protection agreement, allowing eligible investors to continue tax deferral through an UPREIT contribution. Alternatively, investors may elect a cash payment (subject to a 2% cash redemption fee) and structure a further 1031 exchange or cash out on a taxable basis. Ownership is fully passive, with no active management burden.
Analysis of BR Diversified Industrial Portfolio 8, DST
Insights
Strip away the 1031 packaging and this is a laddered corporate-lease bond: an unlevered, all-cash claim on four industrial tenants across five buildings. Zero debt removes refinancing, rate, and balloon risk to basis, but also the leverage that would amplify the ~7.46% cap rate, so the investor clips only a 4.86% Year 1 yield, dipping to 4.82% in Year 2 before laddering toward ~5.96% by Year 10 on 2.5%+ escalations. On relative value the screen is fairer than the headline: the 5.32% average yield Meets its 5.36% benchmark, peak yield Meets Average, and mark-to-market growth screens Above Average, a market-rate coupon at less structural risk than a levered DST. The price is a heavy 11.68% all-in load (up to 9.45% selling costs) on a $58.4M offering struck ~23% above the $47.4M real estate cost and its $48.25M appraisal, equity you must re-earn before principal is whole; the ~20%-below-market rents and ~15% projected submarket growth through 2030 aren't upside, they must hold to break even. The crux is tenant credit, not bricks: four tenants, housing-cyclical BlueLinx as anchor and private, employee-owned Woodsman on two of five buildings, in a Rev. Rul. 2004-86 trust that cannot re-lease or refinance to answer a default. Watch BlueLinx's cycle and thin early coverage: Y1 NOI covers distributions 1.06x and reserves (~$2.1M) sit below long-term needs (~$2.515M). What the marketing buries: Bluerock's 131-deal record of 20.7% average annual return and 1.79x equity came on a 3.86-year average hold running a levered value-add playbook, nothing like this 7-to-10-year unlevered hold-to-collect coupon, so don't underwrite to it. Own it if you're an accredited exchanger prizing basis preservation, passivity, deferral and the optional 721 UPREIT exit over current income; pass if you need 5%-plus cash today, can't stomach four-tenant concentration, or are buying the track record.
Advantages
All-cash, debt-free capitalization removes loan-to-value, refinancing, interest-rate, and balloon-maturity risk, the most common causes of loss in leveraged DSTs, and means no lender can foreclose on investor equity during the hold. The portfolio offers genuine diversification for a single investment: five industrial buildings across four tenants in four states (Florida, Illinois, Missouri), rather than a single asset. Leases are long-term absolute and triple-net with a weighted average remaining term of nearly 13 years and contractual escalations averaging more than 2.5% per year, providing durable, largely predictable cash flow while shifting taxes, insurance, maintenance, and most capital repairs to tenants. Tenant credit is a strength, anchored by publicly traded BlueLinx (NYSE: BXC, ~$2.95 billion revenue), global brand Shure, and long-established Hajoca (founded 1858). In-place rents are cited as roughly 20% below submarket, and the Piper and Warren assets include scarce industrial outdoor storage. The portfolio was acquired below its $48,250,000 'As-Is' appraised value. Investors get a low $100,000 minimum, targeted monthly distributions starting at 4.86% annualized and projected to rise toward 6.06% by later years, an institutional Bluerock sponsor with substantial scale, and a Section 721 FMV Option that provides a potential UPREIT exit and continued tax deferral.
Concerns
The Interests are illiquid: no public market exists or is expected, transfers are restricted, and investors may not realize a return for years, if at all. As DST beneficial owners they have no control and no voting over operations; the Trust operates under Revenue Ruling 2004-86 constraints that prohibit renegotiating or entering new leases, refinancing, reinvesting proceeds, or raising new capital, which limits the Manager's ability to react if a tenant defaults. Although the portfolio holds five buildings, it is concentrated: each property is single-tenant, there are only four tenants, Woodsman occupies two of the five buildings, and the Warren/BlueLinx asset is the largest, so tenant credit is pivotal. The Master Tenant is a Sponsor affiliate with limited capital that may not pay rent and depends on the Operating Partnership to fund a Demand Note; numerous conflicts of interest exist among the affiliated Sponsor, Manager, Master Tenant, property manager, and broker-dealer. The offering load is significant: selling commissions and expenses of up to 9.45%, and an offering price of $58,423,431 against real estate acquired for $47,427,394, roughly 23% above cost, a gap that appreciation must overcome for full principal recovery. Reserves of about $2,100,000 are below the $2,515,101 of estimated long-term capital needs. Three properties (both Jacksonville buildings and Punta Gorda) sit in hurricane-susceptible zones. Distributions are not guaranteed and may be reduced or withheld to fund reserves, and Section 1031 and FMV Option tax treatment carries risk.
BR Diversified Industrial Portfolio 8, DST — Complete Offering Data
Offering & Structure
Investment NameBR Diversified Industrial Portfolio 8, DST
SponsorBluerock
StructureDelaware Statutory Trust (DST)
Offering Type506(c)
StatusAvailable
Last Updated2026-08-18
Size & Availability
Total Offering$58,423,431
Equity$58,423,431
DebtAll-Cash
Available Equity$52,800,000 (90.4% of equity)
Minimum Investment$100,000
Total Load11.68%
Initial Reserves3.59%
Property
Property TypeIndustrial
StrategyCore-Plus
LocationFL, IL, MO
Market TierTier 2
Income & Projections
Average Yield5.32%
Projected Yields (Y1–Y10)Y1 4.86% · Y2 4.82% · Y3 4.94% · Y4 5.06% · Y5 5.23% · Y6 5.37% · Y7 5.51% · Y8 5.65% · Y9 5.81% · Y10 5.96%
Tax-Adjusted Yield6.69%
Cap Rate Equivalent7.46%
Year 1 NOI$2,998,855
Y1 Payout Ratio1.06
Financing
In-Place LTV0.00% LTV
Exit
Estimated Hold Period7-10 years
721 Exchange ExitOptional
Benchmarks (vs sector median)
Avg. Income5.32% vs 5.33% market — Meets Average
Growth22.63% vs 15.09% market — Above Average
Peak5.96% vs 5.80% market — Meets Average
Every data point Baker 1031 tracks for this offering, in one place. Figures are drawn from the offering’s private placement memorandum and sponsor materials unless noted, are summaries for convenience only, and are qualified in their entirety by the PPM. Tap the ⓘ icon next to any label for what it means and how it is calculated.