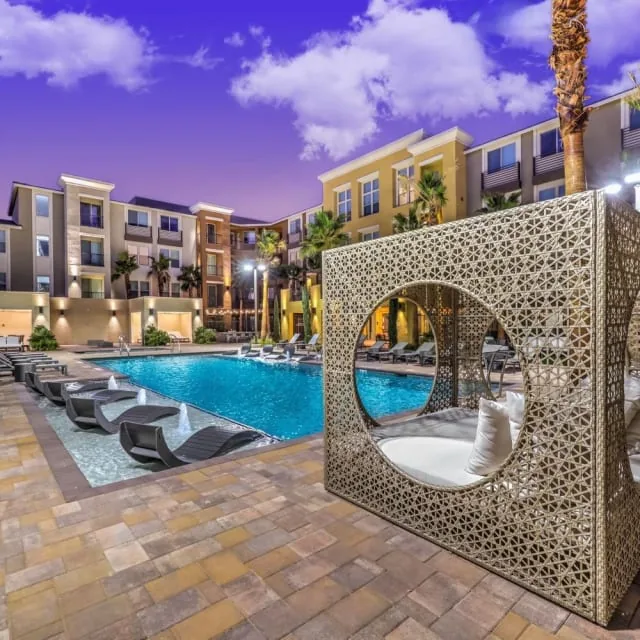
BXREX Portfolio I DST Overview
BXREX Portfolio I DST is a Blackstone-sponsored Delaware statutory trust offering that gives accredited 1031-exchange investors fractional beneficial interests in two stabilized, garden-style multifamily communities located in high-growth Sun Belt markets. The portfolio consists of Avenues at Cypress, a 240-unit community at 21500 Cypresswood Drive in Cypress (greater Houston), Texas, built in 2014 and renovated in 2023, and Vue at Centennial, a 372-unit community at 7350 West Centennial Parkway in Las Vegas, Nevada, built in 2016 and 2018 - 612 units in total across roughly 689,000 rentable square feet. The properties carry allocated purchase prices of $53,441,329 and $113,513,747, respectively, for a combined $166,955,076, and the Parent Trust is offering up to $175,555,053 of Interests with a $1,000,000 minimum investment. Notably, the Interests are offered without any permanent financing encumbering the properties - an all-cash, debt-free capital structure. The trust leases both communities to an affiliated Master Tenant under a 10-year triple-net Master Lease whose payment obligations are unconditionally guaranteed by BREIT Operating Partnership L.P., producing fixed, contractual rent to the trust. The Sponsor, Blackstone Real Estate Exchange LLC, is an indirect subsidiary of Blackstone Real Estate Income Trust (BREIT) and is advised by an affiliate of Blackstone, with Blackstone Securities Partners L.P. serving as dealer manager. The Offering is structured as a private placement exempt under Rule 506 of Regulation D of the Securities Act and is designed for investors seeking to defer capital-gains tax under Section 1031 while owning institutional-quality real estate on a passive, professionally managed basis. It suits accredited investors who want current income, no day-to-day management responsibility, a long-term hold horizon and - through the Fair Market Value Option - potential future access to a diversified BREIT portfolio via a Section 721 exchange into OP Units.
Highlights
Both communities sit in established, demand-driven Sun Belt submarkets. Avenues at Cypress is roughly 29 miles northwest of downtown Houston, the fifth-largest U.S. metro, with a population near 7.8 million projected to exceed 10 million by 2035 and decade-long population growth of about 19%. The PPM notes Houston remains comparatively affordable - average rents near $1,380/month, well below Austin, Dallas-Fort Worth and national levels - and its construction pipeline has thinned to 14-year-low starts, setting the stage for renewed rent growth as supply slows. Vue at Centennial is in northern Las Vegas, a metro of about 2.4 million adding roughly 25,000 residents per year, where the PPM cites new supply-to-inventory near 3% (versus 9-12% at Sun Belt peers) and vacancy recovering to about 6.5%, supported by a large 2027-2028 job-creation pipeline that includes the Athletics ballpark, Brightline West, a new children's hospital and other projects. Both markets benefit from single-family unaffordability channeling demand into rentals.
The portfolio is modern, well-amenitized and institutionally maintained. Avenues at Cypress (built 2014, renovated 2023) offers 240 one-, two- and three-bedroom units across 24 two-story buildings on 17.81 acres with 425 parking spaces, a saltwater pool and pool house, an outdoor kitchen and two grill areas, a fitness center, a dog park and dog wash, and a resident retreat; interiors feature stainless Whirlpool appliances, granite countertops, vinyl-plank flooring and in-unit full-size washers and dryers. Vue at Centennial (built 2016 and 2018) provides 372 one-, two- and three-bedroom units across nine three-story elevator-served buildings on 15.82 acres with 652 spaces, two heated swimming pools and whirlpool spas, a community room and kitchen, a fitness center and a business center, with quartz countertops and in-unit laundry. Both communities are leased to an affiliated Master Tenant that manages day-to-day operations and subleases the units to residents under standard residential leases.
A defining feature of this offering is its all-cash, debt-free capital structure: the Parent Trust is offering the Interests without any permanent financing encumbering the properties. That removes the balloon-maturity, refinancing and lender-foreclosure risks that burden most leveraged DSTs, and it means investor distributions are not reduced by mortgage debt service. Investor income is instead supported by a 10-year triple-net Master Lease with fixed Stated Rent of $7,329,000 per year in years one through five, stepping up to $8,061,900 in years six through ten, all unconditionally and irrevocably guaranteed by BREIT Operating Partnership L.P. The maximum offering of $175,555,053 exceeds the combined $166,955,076 allocated property purchase price by roughly $8.6 million, which funds offering fees, selling compensation and certain trust cash reserves. Broker-dealer fees and commissions may reach up to 3.5% of the maximum offering amount, with an ongoing investor servicing fee of up to 0.85% per year.
The offering carries Blackstone sponsorship end to end. The Sponsor, Blackstone Real Estate Exchange LLC, is an indirect subsidiary of Blackstone Real Estate Income Trust (BREIT), and both BREIT and its operating partnership are externally advised by BX REIT Advisors, an affiliate of Blackstone - a leading global investment manager with dedicated private equity, real estate, credit and infrastructure platforms. BREIT invests primarily in stabilized, income-generating commercial real estate across asset classes, giving the DST access to institutional acquisition, asset-management and property-management capabilities. Blackstone Securities Partners L.P., a Blackstone subsidiary and FINRA-member broker-dealer, serves as dealer manager; a Blackstone-affiliated Trust Manager (BXREX Portfolio I Manager, LLC) operates the trusts, while the affiliated Master Tenant runs the communities. Both properties were previously owned by BREIT-affiliated entities before their contribution to the DST, and the offering is being made in part to return capital to the BREIT-affiliated depositor.
The structure is purpose-built for tax deferral. Acquisition of an Interest is intended to be treated as a direct acquisition of real property for Section 1031 purposes, and tax counsel has issued a 'should'-level DST opinion supporting that treatment, allowing exchangers to defer federal and state capital-gains tax by replacing relinquished property with trust Interests. Beyond the initial exchange, the offering provides a distinctive exit: the Fair Market Value Option grants BREIT's Operating Partnership the right - beginning on the last day of the 24th month following the Offering Termination Date - to acquire investors' Interests in exchange for OP Units in a transaction intended to qualify as a tax-deferred Section 721 'UPREIT' exchange. That would give investors continued tax deferral and a beneficial interest in a large, diversified, professionally managed BREIT portfolio, followed by a later cash-option period and an optional, limited investor cash election (expected to be capped at about 15% of aggregate consideration).
Analysis of BXREX Portfolio I DST
Insights
Read BXREX Portfolio I DST as a short-duration credit trade in a multifamily costume: the exchanger is really buying a Blackstone-guaranteed rent stream that converts into a stake in BREIT - the 612 Sun Belt units are collateral, not the investment. Income is deliberately thin: 3.2% flat through year five, 3.62% thereafter, averaging ~3.41%. That screens Below Average on every axis of the multifamily benchmark - income versus a ~4.85% average, peak yield of 3.62% versus ~5.55%, and growth - the toll for the guarantee and an all-cash, debt-free structure that removes the refinancing and foreclosure risk which sinks leveraged DSTs. Thin is not fragile: at a 1.3x Year-1 payout ratio the distribution is covered by in-place NOI with ~30% to spare - covered income, not a return of capital - and sits inside the assets' 5.76% cap-rate-equivalent. The load reads light at ~1%, but the real cost is the ~5% premium of the $175.6M offering over $167.0M of property value, plus up to 3.5% selling comp and a 0.85% annual servicing fee, all of which must be earned back. The crux is not rent collection but the Fair Market Value Option: ~24 months out, BREIT's operating partnership can sweep every Interest into non-appraised OP units that may distribute less and turn liquid only through BREIT's redemption program, which can be gated - on terms the investor cannot control. What the marketing buries: the ten-year master lease is theater, because the mandatory 721 makes this a two-year DST feeding a BREIT position - the real diligence is BREIT the fund, not two apartment complexes. Own it for exchangers who prize capital preservation, durable tax deferral, and Blackstone as counterparty and accept ending up in BREIT; pass anyone wanting independent sponsorship, higher current income, appreciation or leverage upside, property-type diversification, or a cash exit at a cap rate they set.
Advantages
Institutional Blackstone sponsorship, with BREIT as the ultimate parent and an affiliated adviser, dealer manager, trust manager and master tenant providing fully passive, professionally managed ownership. All-cash, debt-free capital structure with no permanent financing on the properties, eliminating mortgage debt service, refinancing exposure and lender-foreclosure risk that commonly threaten leveraged DSTs. Contractual, predictable income from a 10-year triple-net Master Lease with fixed, escalating Stated Rent ($7,329,000 rising to $8,061,900) that is unconditionally guaranteed by BREIT Operating Partnership L.P., shifting operating-expense and management burden to the master tenant. Modern, stabilized, well-amenitized assets - 612 units total across two garden-style communities built between 2014 and 2018 (Cypress renovated in 2023) - in growing, supply-constrained Sun Belt markets (greater Houston and Las Vegas) with favorable long-term population, employment and rental-demand drivers and relative housing affordability. Full Section 1031 eligibility supported by a tax-counsel DST opinion, a low $1,000,000 minimum, and single-class Interests carrying identical rights. A differentiated exit through the Fair Market Value Option, offering a potential Section 721 exchange into BREIT OP Units for continued tax deferral and portfolio diversification, or a later cash option. Modest geographic and vintage diversification across two metros and two communities rather than a single building, reducing concentration relative to single-property DSTs.
Concerns
Illiquidity and no public market: Interests (and any OP Units or BREIT shares received) cannot be readily resold, transfer is restricted, and investors must be able to hold indefinitely and can lose their entire investment. No control: investors cannot manage the properties or vote on operations; the Trust Manager and trustees have limited duties and limited authority under DST constraints, and generally cannot renegotiate leases or refinance without converting to a Springing LLC. Reliance on affiliates: the trust depends entirely on the affiliated Master Tenant for revenue and on the BREIT Operating Partnership as guarantor; a bankruptcy, insolvency or default by the Master Tenant or Guarantor would materially harm operations and distributions. Concentration: the investment is not diversified as to asset type - two multifamily assets only - exposing investors to multifamily, Houston and Las Vegas market, and resident-default risk. Conflicts of interest: the Sponsor, adviser, dealer manager, trust manager and master tenant are all Blackstone affiliates; agreements were not negotiated at arm's length, the dealer manager is not independent, and the properties may compete with other Blackstone-owned assets. Fees and load: the purchase price exceeds the properties' allocated value (a $175.6M maximum offering versus $167.0M of property) to cover offering costs and reserves, with broker-dealer compensation up to 3.5% plus an ongoing investor servicing fee up to 0.85% per year, so investors pay more than pro-rata market value and must recover that spread to profit. Forced exit and uncertain value: the Operating Partnership may exercise the Fair Market Value Option and compel exchange of Interests for OP Units (which are not appraised and may carry a lower distribution rate) or for cash at a fair market value that could be less than the amount invested, with investors having no control over timing. Tax risk: 1031 and 721 qualification rests on assumptions and a 'should'-level opinion, not an IRS ruling, and adverse legislation, a delayed closing or the Fair Market Value Option itself could jeopardize deferral, while boot, passive-activity and at-risk rules may create unexpected tax.
BXREX Portfolio I DST — Complete Offering Data
Offering & Structure
Investment NameBXREX Portfolio I DST
SponsorBlackstone
StructureDelaware Statutory Trust (DST)
Offering Type506(b)
StatusUnder Review
Last Updated2026-07-13
Size & Availability
Total Offering$175,555,053
Equity$175,555,053
DebtAll-Cash
Available Equity$175,555,053 (100% of equity)
Minimum Investment$1,000,000
Total Load1.00%
Initial Reserves0.40%
Property
Property TypeMultifamily
StrategyCore
LocationNV, TX
Market TierTier 1
Income & Projections
Average Yield3.41%
Projected Yields (Y1–Y10)Y1 3.20% · Y2 3.20% · Y3 3.20% · Y4 3.20% · Y5 3.20% · Y6 3.62% · Y7 3.62% · Y8 3.62% · Y9 3.62% · Y10 3.62%
Tax-Adjusted Yield7.40%
Cap Rate Equivalent5.76%
Year 1 NOI$7,329,000
Y1 Payout Ratio1.3
Financing
In-Place LTV0.00% LTV
Exit
Estimated Hold Period2 Years
721 Exchange ExitMandatory
Benchmarks (vs sector median)
Avg. Income3.41% vs 4.85% market — Below Average
Growth13.13% vs 24.88% market — Below Average
Peak3.62% vs 5.55% market — Below Average
Every data point Baker 1031 tracks for this offering, in one place. Figures are drawn from the offering’s private placement memorandum and sponsor materials unless noted, are summaries for convenience only, and are qualified in their entirety by the PPM. Tap the ⓘ icon next to any label for what it means and how it is calculated.