CS1031 Texas Active Living Portfolio II, DST Overview
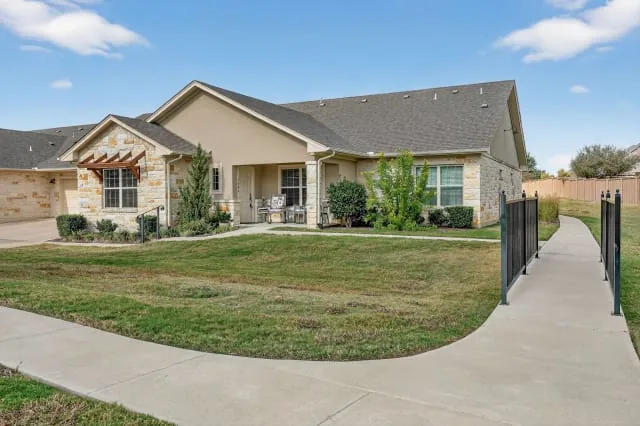
A 64-unit, two-asset active-adult (55+) portfolio comprising Emerald Cottages of Kerrville (32 units, vintage 2019, Texas Hill Country) and Emerald Cottages of Round Rock (32 units, vintage 2018, Austin MSA / Williamson County), each a single-story, cottage-style community of detached 2BR/2BA homes averaging 1,350 SF with attached garages, ADA-accessible step-free layouts, and clubhouse amenities. Both assets are 100% occupied with 10+ resident waitlists secured by $1,000 deposits, zero bad debt, and no concessions. The thesis pairs a recession-resilient, demographically tailwinded niche — needs-based active-adult housing for an aging cohort (48% of the Kerrville zip is 50+) — with an all-cash, debt-free capital structure that eliminates refinancing and rate-cap exposure across the ten-year hold. Operations run through a master-lease structure with Capital Square-affiliated master tenants and Carbon Shepherd as on-site manager, targeting a 5.65% Year 1 yield-on-cost stepping to 7.51% by Year 10 on contractual base-rent escalations averaging roughly 3% annually.
Highlights
The portfolio occupies the active-adult (55+) niche that sits structurally between conventional market-rate multifamily and licensed senior housing, capturing needs-based demographic demand without the operational intensity, regulatory overhead, or labor-cost volatility of assisted living or memory care. Demand is anchored by an aging-in-place cohort: 48% of the population within the Kerrville property's zip code is age 50+, and the Hill Country functions as a regional retirement destination. This positioning insulates rent rolls from the discretionary-move-out behavior that pressures conventional Class A multifamily during economic softening.
Both assets are 100% occupied with documented waitlists exceeding ten prospective residents each, every entry backed by a $1,000 deposit — a tangible, capitalized indicator of unmet submarket demand rather than aspirational lease-up assumptions. The trailing-twelve-month operating history shows zero bad debt, no concessions, and resident retention of 91% (Kerrville) and 81% (Round Rock), signaling sticky tenancy and minimal turnover frictional cost that underpins the forecast effective-gross-income stability.
The all-cash, no-mortgage-debt capitalization removes the single largest source of DST mid-cycle distress: refinancing risk and interest-rate-cap repurchase cost at loan maturity. With no debt service, the full NOI stream converts to distributable cash flow, the Year 1 yield-on-cost of 5.65% accretes to 7.51% by Year 10 on contractual escalations, and the asset can be sold or contributed into a 721 UPREIT transaction on the Sponsor's timing without lender consent, defeasance, or prepayment penalty constraints.
The Round Rock asset benefits from a demonstrably supply-constrained submarket: only 200 units of construction starts over the trailing two years, with submarket vacancy improving more than six percentage points in 2025 — the third-sharpest reduction among Austin submarkets. Sited within the Teravista master-planned community (18-hole golf course, fitness, pickleball, 10+ miles of trails) in a county that grew 19.4% from 2020–2024 with ~$108,000 median household income, the asset combines a high-growth metro with a near-term barrier to competitive new deliveries.
The Sponsor's full subordination of its disposition fee to investors' return of capital creates explicit co-investment alignment at the exit, deferring sponsor compensation until principal is recovered. Combined with the cottage-style, detached single-story product format — which carries lower turnover capital intensity than stacked-flat multifamily and appeals to a long-tenure resident base — the structure aligns sponsor economics with the durability of the forecast cash flows rather than transactional fee velocity.
Analysis of CS1031 Texas Active Living Portfolio II, DST
Insights
Read correctly, this is an unlevered, bond-like income sleeve dressed as real estate: an all-cash active-adult portfolio bought for a durable coupon rather than appreciation, where the investor deliberately trades return amplification for removal of the failure mode — maturity-date refinancing — that has defined distressed DST vintages of the 2023–2025 rate regime. On relative value the pricing is honest but unspectacular. The ~5.00% average distribution meets the senior-living market average almost exactly (5.00% vs 5.05%), yet both peak yield (a Year-10 distribution near 5.70% against a ~6.45% peer peak) and projected growth screen Below Average — the allocator matches the category on current income while conceding its upside. Year-1 distributions run marginally ahead of in-place NOI (payout ratio ~1.03), a thin early reserve draw that contractual ~3% escalations are underwritten to close, not a leverage-funded coupon. The offset is cost: an 11.36% total load is heavy, and with no debt to amplify returns the investor pays a full retail markup for simplicity and safety rather than for yield. The crux is master-tenant credit: cash flow runs through two Capital Square-affiliated master tenants capitalized solely by underlying sublease rents, with no sponsor backstop for shortfalls, over a thin 64-unit, single-state Texas base exposed to post-sale tax reassessment; we would watch resident-level occupancy and rent achievement at Round Rock, whose 81% trailing retention leaves the least cushion against the forecast. The non-obvious tension: the same all-cash structure that strips out downside also forgoes the leverage that lets many DSTs shelter more income per equity dollar, and the narrow active-adult buyer pool can thin the exit — making the optional 721 UPREIT conversion as much a liquidity backstop as an upside lever. It fits a conservative 1031 investor prioritizing principal preservation, predictable income, and refinancing-free sleep over total return; it is wrong for anyone underwriting appreciation, leverage-driven IRR, or a low all-in cost basis.
Advantages
The offering pairs a debt-free balance sheet with two fully stabilized, 100% occupied active-adult communities of recent vintage (2018/2019), eliminating leverage-driven refinancing and rate-cap exposure while delivering a forecast distribution profile that escalates from 4.50% to 5.70% over a ten-year hold on contractual base-rent growth. The niche captures durable, demographically supported demand from an aging 55+ cohort, with documented deposited waitlists at both assets evidencing real excess demand. Macro positioning is favorable: Round Rock sits in a high-in-migration Austin submarket (Williamson County +19.4% 2020–2024) with a constrained near-term supply pipeline, while Kerrville offers a low-cost, healthcare-anchored Hill Country retirement market with limited cyclical sensitivity. Operating fundamentals — zero bad debt, no concessions, high retention, and the lowest operating expenses within the Sponsor's broader cottage portfolio at the Kerrville asset — reinforce the credibility of the underwritten EGI.
Concerns
The cash-flow stream depends on master-lease performance by two Capital Square-affiliated master tenants whose capitalization is supported solely by underlying sublease rents, with no Sponsor obligation to fund shortfalls — a structural credit dependency that concentrates risk if resident-level rents underperform the forecast. The 64-unit, two-property scale offers limited diversification: a single-market (Texas) concentration with both assets exposed to Texas real-estate-tax dynamics, where the forecast carries real estate taxes escalating from $345,249 to $485,759 over the hold, a line item vulnerable to reassessment following the recent transaction. The Round Rock asset's reliance on the Dell/Amazon/St. David's employment base ties resident formation to Austin-metro economic concentration, and the active-adult format's narrow tenant profile constrains the prospective buyer pool at disposition relative to conventional multifamily. The forecast assumes uninterrupted ~3% annual rent escalation and improving vacancy despite Round Rock's TTM retention of 81%, leaving modest cushion if Hill Country or Austin-submarket demand normalizes.
CS1031 Texas Active Living Portfolio II, DST — Complete Offering Data
Offering & Structure
Investment NameCS1031 Texas Active Living Portfolio II, DST
SponsorCapital Square
StructureDelaware Statutory Trust (DST)
Offering Type506(c)
StatusConfirm Availability
Last Updated2026-08-11
Size & Availability
Total Offering$32,700,000
Equity$32,700,000
DebtAll-Cash
Available Equity$5,019,885 (15.4% of equity)
Minimum Investment$50,000
Total Load11.36%
Initial Reserves4.42%
Property
Property TypeSenior Living
StrategyCore
LocationTX
Market TierTier 2
Income & Projections
Average Yield5.00%
Projected Yields (Y1–Y10)Y1 4.50% · Y2 4.54% · Y3 4.59% · Y4 4.72% · Y5 4.88% · Y6 5.03% · Y7 5.19% · Y8 5.36% · Y9 5.53% · Y10 5.70%
Tax-Adjusted Yield11.34%
Cap Rate Equivalent7.09%
Year 1 NOI$1,508,442
Y1 Payout Ratio1.03
Financing
In-Place LTV0.00% LTV
Exit
Estimated Hold Period10 years
721 Exchange ExitOptional
Benchmarks (vs sector median)
Avg. Income5.00% vs 5.05% market — Meets Average
Growth26.67% vs 41.07% market — Below Average
Peak5.70% vs 6.45% market — Below Average
Every data point Baker 1031 tracks for this offering, in one place. Figures are drawn from the offering’s private placement memorandum and sponsor materials unless noted, are summaries for convenience only, and are qualified in their entirety by the PPM. Tap the ⓘ icon next to any label for what it means and how it is calculated.