← Back to all investments
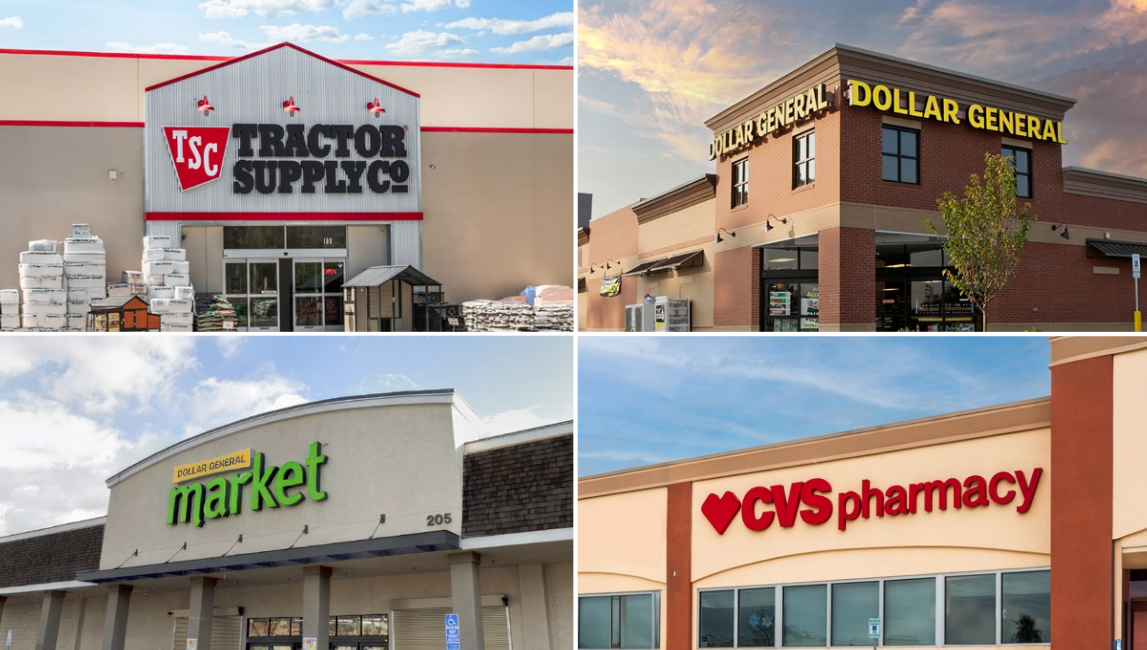
ExchangeRight Net-Leased Portfolio 74 DST property photo

ExchangeRight Net-Leased Portfolio 74 DST

Sponsored by ExchangeRight
Minimum Investment$100,000
Total Offering$63,340,000
Available Equity$36,590,000 100% available
Equity$36,590,000
Debt$26,750,000
In-Place LTV42.23% LTV
Average Yield5.20%
Est. Tax-Adjusted Yield¹11.84%
Cap Rate Equivalent8.56%
LocationCA, IA, MI, MS, NC, NE, OH, PA, TX
Estimated Hold Period10 years
721 Exchange ExitOptional
StrategyCore
Offering Type506(b)
Connected REITExchangeRight Income REIT
StatusAvailable

ExchangeRight Net-Leased Portfolio 74 DST Overview

ExchangeRight Net-Leased Portfolio 74 DST is a $63.34 million (total capitalization) Delaware Statutory Trust offering interests in a diversified portfolio of eleven single-tenant, net-leased retail properties totaling approximately 198,705 square feet across nine states (North Carolina, California, Ohio, Michigan, Texas, Mississippi, Pennsylvania, Iowa, and Nebraska). The portfolio is leased to necessity-based national retailers - CVS Pharmacy, Dollar General, and Tractor Supply Company - with most locations carrying investment-grade BBB credit and a weighted-average remaining lease term of roughly 16.3 years. The offering raises $36.59 million of equity against a $26.75 million non-recourse Barclays loan (42.23% loan-to-value) fixed at 6.080% and interest-only for a ten-year term. Interests are intended to qualify as Section 1031 replacement property, with an optional (full) Section 721 exchange into the ExchangeRight Income REIT available as an exit. Distributions are projected to begin at 5.00% annualized, holding near that level through year five before stepping up to 5.40% for years six through ten (about a 5.20% average). The appraised value of $55.81 million modestly exceeds the $55.27 million purchase price, and first-year net operating income is approximately $3.61 million.

Highlights

Broad geographic and property diversification. The portfolio spans eleven separate single-tenant properties across nine states and eleven distinct markets, materially reducing single-asset and single-location exposure relative to a typical DST. Locations sit along established retail corridors in suburban trade areas that serve daily consumer needs, and the majority of the buildings are newer construction, with build years ranging from the late 1960s to 2025 and several properties delivered in 2024-2025.

Necessity-based, largely investment-grade tenancy. The rent roll is anchored by CVS Pharmacy, Dollar General (Dolgencorp), and Tractor Supply Company - necessity-based retailers that historically demonstrate lower sales volatility during economic downturns. Most locations carry BBB investment-grade credit, providing durable, creditworthy income, though the portfolio is concentrated in Tractor Supply (approximately 72% of the portfolio), with one Tractor Supply location rated BB and one unrated.

Long-term, laddered net leases. The portfolio carries a weighted-average remaining lease term of roughly 16.3 years on long-term net leases with minimal landlord operating responsibility, providing extended, contractual income visibility well beyond the ten-year projected hold. Lease structures are a mix of triple-net (NNN) and double-net (NN); rent escalations are modest (approximately 1% assumed growth), which trades income growth for lease-term stability and creditworthy tenancy.

Fixed-rate, interest-only financing. The portfolio is financed with a $26.75 million non-recourse Barclays loan at a 42.23% loan-to-value, fixed at 6.080% and interest-only for its ten-year term, giving full rate certainty and maximizing distributable cash flow with no amortization during the hold. First-year net operating income of approximately $3.61 million covers estimated debt service roughly 2.22 times, and the interest-only structure aligns the loan term with the projected ten-year hold.

Established sponsor with a full-cycle track record. ExchangeRight, formed in 2012, reports more than $5.6 billion in assets under management and investment across 1,200-plus properties in 47 states, and states that all of its full-cycle offerings have met or exceeded projected returns and that it has consistently paid 100% of projected distributions across its DST offerings. The offering provides an optional Section 721 exchange into the ExchangeRight Income REIT as a potential tax-deferred aggregation exit alongside 1031 and cash-out alternatives.

Analysis of ExchangeRight Net-Leased Portfolio 74 DST

Insights

Net-Leased Portfolio 74 is best read as a bond-proxy for investment-grade retail credit - an income vehicle bought for durable, laddered net-lease coupons and a defined REIT-aggregation exit, not for rent growth or appreciation. The defensive case is real: eleven single-tenant properties across nine states, a roughly 16.3-year weighted-average lease term, mostly BBB tenants in recession-resilient categories (CVS, Dollar General, Tractor Supply), and clean fixed-rate, interest-only, non-recourse financing at a conservative 42.23% LTV with about 2.22x first-year debt-service coverage. On relative value the pricing is unremarkable in the right way and expensive in one: the ~5.20% average and 5.40% peak distribution both merely meet the net-lease market average (roughly 5.11% income, 5.34% peak), and projected growth meets rather than beats it - the investor buys category-average income, not a yield premium. What is not average is the cost of entry: a heavy 12.19% total load sends nearly an eighth of capital to frictions before a dollar is at work, the price of ExchangeRight's aggregation and the optional 721 wrapper. A first-year payout ratio near 1.09 adds that the opening 5.00% distribution slightly outruns property income, leaning marginally on reserves rather than being fully NOI-covered - the yield is engineered a touch rich early. The outcome hinges on concentration and exit liquidity. With roughly 72% of the portfolio in Tractor Supply - plus one BB-rated store, one unrated, and three Class C assets - the "diversified, investment-grade" headline is really a single-retailer credit bet, and that is the exposure to watch. Liquidity is subtler: the third-party report flags that ExchangeRight's limited cash-out capacity may funnel investors into the REIT rather than a clean 1031, so the practical exit may be a roll-up despite the 721's optional label, and the ten-year interest-only balloon stacks refinance/sale risk at maturity with no amortization. Net, this suits a 1031 investor who wants defensive, investment-grade-leaning net-lease income, values the long lease ladder and conservative leverage, and can accept a heavy load, flat income, and concentrated Tractor Supply credit. Those needing above-market yield, real rent growth, a low entry cost, or an assured cash-out at exit should pass.

Advantages

The offering delivers meaningful diversification for a single DST - eleven single-tenant properties across nine states and eleven markets - leased to necessity-based national retailers (CVS, Dollar General, Tractor Supply) that are historically resilient through downturns, with most locations carrying investment-grade BBB credit and a long roughly 16.3-year weighted-average lease term that provides durable, laddered income. Financing is clean and predictable: a 42.23% loan-to-value, non-recourse Barclays loan fixed at 6.080% and interest-only for ten years, producing about 2.22x first-year debt-service coverage with rate certainty and no amortization risk during the hold. The appraised value modestly exceeds the purchase price, distributions begin at 5.00% and step up to 5.40% by year six, and ExchangeRight brings a well-regarded aggregation platform with more than $5.6 billion in AUM and a stated 100% record of paying projected DST distributions. An optional Section 721 exchange into the ExchangeRight Income REIT provides a defined, tax-deferred liquidity alternative to a market sale. For 1031 investors seeking diversified, investment-grade-leaning net-lease income with conservative financing, the portfolio is a stable, income-oriented core holding.

Concerns

Despite the diversified branding, tenant concentration is real: approximately 72% of the portfolio is Tractor Supply Company, so outcomes depend heavily on a single retailer, and not all locations are investment-grade (one Tractor Supply store is rated BB and one is unrated, and three assets are Class C). Distribution growth is modest - 5.00% holding through year five before stepping to 5.40% - reflecting roughly 1% assumed rent escalations, so total return leans on exit value rather than income growth. Liquidity at exit is a key uncertainty: the third-party report notes that ExchangeRight's current limited capacity for cash-out exits may result in investors being rolled into the Sponsor's REIT platform, which could restrict flexibility for those seeking a subsequent 1031 exchange, and while the 721 option is described as full/optional, the practical cash-out path is not assured. The offering uses leverage (42.23% loan-to-value) with a ten-year interest-only balloon and no principal amortization, concentrating refinancing or sale risk at maturity, and one property is located in California with its attendant regulatory and cost exposure. As with all DSTs, Owners have no voting rights or operational control, rely on the Sponsor and master lessee, bear an upfront load, and face standard 1031, tax, and illiquidity risks detailed in the Memorandum.

ExchangeRight Net-Leased Portfolio 74 DST Projected Distributions

Average Yield5.20%
Est. Tax-Adjusted Yield¹11.84%
Cap Rate Equivalent8.56%
Y15.00%
Y25.00%
Y35.00%
Y45.00%
Y55.01%
Y65.40%
Y75.40%
Y85.40%
Y95.40%
Y105.40%

Projected, not guaranteed. Distribution rates are the sponsor’s projections, are not a promise of performance, and can be reduced or suspended. ¹ Estimated Tax-Adjusted Yield reflects the projected impact of depreciation and amortization deductions at an assumed combined federal and state tax rate; individual tax outcomes vary — consult your CPA regarding your specific situation. Cap Rate Equivalent is a Baker 1031 Investments calculation intended to allow comparison with direct property ownership; it is not a sponsor-reported figure and does not represent a rate of return. See the private placement memorandum for the assumptions behind these figures.

ExchangeRight Net-Leased Portfolio 74 DST Financing

LenderBarclays Capital Real Estate Inc.
Loan TypeFixed
Interest Rate6.080% (Fixed)
Loan Term10 years
I/O Period10 years
AmortizationN/A (interest-only)
Y1 DSCR2.22x

Benchmarks

Avg. Income
This deal5.20%
Market5.11%
Meets Average
Growth
This deal8.00%
Market7.52%
Meets Average
Peak
This deal5.40%
Market5.34%
Meets Average

Benchmarks are calculated by Baker 1031 Investments: each metric is compared against the average across current offerings of the same property type tracked by Baker 1031 as of the last-updated date shown; a figure within ±10% of that average reads “Meets Average.” Benchmark data is internal, unaudited, and subject to change. Review each offering’s PPM for complete information.

ExchangeRight Net-Leased Portfolio 74 DST Documents

ExchangeRight Net-Leased Portfolio 74 DST — Complete Offering Data

Offering & Structure
Investment NameExchangeRight Net-Leased Portfolio 74 DST
SponsorExchangeRight
StructureDelaware Statutory Trust (DST)
Offering Type506(b)
StatusAvailable
Last Updated2026-07-29
Size & Availability
Total Offering$63,340,000
Equity$36,590,000
Debt$26,750,000
Available Equity$36,590,000 (100% of equity)
Minimum Investment$100,000
Total Load12.19%
Initial Reserves3.63%
Property
Property TypeNet Lease
StrategyCore
LocationCA, IA, MI, MS, NC, NE, OH, PA, TX
Market TierTier 3
Income & Projections
Average Yield5.20%
Projected Yields (Y1–Y10)Y1 5.00% · Y2 5.00% · Y3 5.00% · Y4 5.00% · Y5 5.01% · Y6 5.40% · Y7 5.40% · Y8 5.40% · Y9 5.40% · Y10 5.40%
Tax-Adjusted Yield11.84%
Cap Rate Equivalent8.56%
Year 1 NOI$3,612,723
Y1 Payout Ratio1.09
Financing
In-Place LTV42.23% LTV
LenderBarclays Capital Real Estate Inc.
Loan TypeFixed
Interest Rate6.080% (Fixed)
Loan Term10 years
I/O Period10 years
AmortizationN/A (interest-only)
Y1 DSCR2.22x
Exit
Estimated Hold Period10 years
721 Exchange ExitOptional
Connected REITExchangeRight Income REIT
Benchmarks (vs sector median)
Avg. Income5.20% vs 5.11% market — Meets Average
Growth8.00% vs 7.52% market — Meets Average
Peak5.40% vs 5.34% market — Meets Average

Every data point Baker 1031 tracks for this offering, in one place. Figures are drawn from the offering’s private placement memorandum and sponsor materials unless noted, are summaries for convenience only, and are qualified in their entirety by the PPM. Tap the ⓘ icon next to any label for what it means and how it is calculated.