HPA Exchange - Vital Medical Dallas TX DST Overview
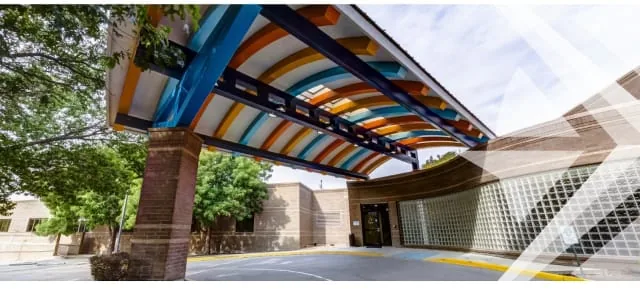
HPA Exchange - Vital Medical Dallas TX DST is a Regulation D, Rule 506(c) private placement offering beneficial interests in a newly formed Delaware statutory trust to accredited investors seeking Section 1031 exchange replacement property. The Trust owns a single, 100%-occupied asset: an approximately 86,880-square-foot, 30-bed children's hospital on a 3.64-acre parcel at 9505 and 9525 Greenville Avenue in Dallas, Texas. The facility was built in 1997 and renovated in 2022 in connection with the current tenancy, and includes a three-story hospital building and a two-level, 146-space parking structure. Income flows through a two-tier net-lease structure: the Trust master leases the property to an affiliated master tenant under a 10-year master lease with three five-year renewal options, and that master tenant has assumed an absolute triple-net sublease with the operating tenant, Nexus Children's Hospital - Dallas, LLC, whose performance is guaranteed by Nexus Health Systems, Inc. The sublease runs through March 31, 2038 with 2.5% annual rent escalations and automatic five-year renewals. The maximum offering is $19,920,000, comprising $9,670,000 of equity and $10,250,000 of attributable, nonrecourse debt from First Horizon Bank; the minimum investment is $50,000 of equity (a 0.51706% interest). The Trust acquired the property on August 29, 2025 for a $17,100,000 purchase price. The sponsor, HPA Exchange, LLC (a subsidiary of The Innovation Institute), targets a non-guaranteed first-year distribution of approximately 5.35%, an average near 5.40% over the loan term, and a three-to-five-year hold, with an optional Section 721 UPREIT exit in addition to a traditional sale. The structure suits accredited 1031 exchangers seeking passive, single-tenant, net-leased healthcare real estate with monthly income potential, tax deferral, and no day-to-day management responsibility, who can accept illiquidity, leverage, and single-asset concentration.
Highlights
The property sits along Greenville Avenue in the Lake Highlands area of northeast Dallas, within the Dallas-Fort Worth metroplex - one of the largest and fastest-growing metropolitan economies in the United States. Per the appraisal cited in the memorandum, the Dallas Metropolitan Statistical Area had an estimated 2025 population of 8,342,575 and added an average of roughly 141,038 residents per year between 2020 and 2025. The area's median household income of $91,813 runs about 14.82% above the Texas figure and 26.46% above the national figure, and the share of college graduates exceeds the national average. Within a five-mile radius, the housing stock is established (median year built 1979) and 40.91% owner-occupied. This deep, expanding, comparatively affluent population base helps underpin sustained demand for pediatric and specialty healthcare services in the submarket the facility serves.
The asset is a purpose-built, 30-bed children's hospital totaling approximately 86,880 rentable square feet on 3.64 acres, constructed in 1997 and renovated in 2022 concurrent with the current lease. It was 100% occupied as of the August 2025 closing. Income is secured through an absolute triple-net sublease to Nexus Children's Hospital - Dallas, LLC - under which the operating tenant bears taxes, insurance, utilities, maintenance, and structural repairs - guaranteed by Nexus Health Systems, Inc. In-place base rent for the April 2025-March 2026 sublease year is about $1,118,146 (roughly $12.87 per square foot), escalating 2.5% annually through the March 31, 2038 term and any renewals. A June 2025 Property Condition Assessment found the property in good overall condition, estimating only about $22,000 of capital needs over a five-year hold (plus a roughly $5,000 elevator inspection), and a Phase I environmental report identified no recognized environmental conditions.
The Trust financed the acquisition with a $10,250,000 senior loan from First Horizon Bank against $9,670,000 of equity, for total capitalization of $19,920,000 and a DST loan-to-value of 51.46% (about 59.25% measured against the $17,300,000 appraised value). The loan is nonrecourse to the guarantors, subject to customary 'bad-boy' carveouts, and nonrecourse to investors. It carries a seven-year term maturing August 29, 2032, with interest-only payments for the first four years followed by principal-and-interest on a 25-year amortization schedule. Although the stated rate is variable at 30-day SOFR plus a 2.15% margin, an interest-rate hedge fixes the effective rate at 5.699% for the loan term, removing floating-rate exposure during the hold. A lender-held reserve of $383,160 is funded at full syndication, and a roughly $50,000 master tenant reserve provides additional operating cushion.
The offering is sponsored by HPA Exchange, LLC, based in Brea, California, a subsidiary of The Innovation Institute, a healthcare-focused organization. HPA Exchange - Vital Medical Dallas TX ST LLC, an affiliate of the sponsor, serves as signatory trustee with primary responsibility for managing the Trust and deciding when to sell, while Wilmington Corporate Services, LLC acts as the Delaware trustee. American Alternative Capital, LLC, a FINRA member, is the managing broker-dealer. Investors are entirely passive: an affiliated master tenant holds the master lease and the third-party operator runs the hospital, so the sponsor and its affiliates handle asset management, distributions, and eventual disposition. The memorandum candidly discloses that this is only the sponsor's second DST offering, though it notes the experience of its personnel and affiliates in healthcare real estate. The sponsor earns an asset management fee of 2% of rent plus a $12,500 annual accounting fee.
Structured as a Delaware statutory trust, the offering is designed so that each investor is treated, for federal income tax purposes, as owning a direct interest in the underlying real estate - qualifying the interests as replacement property for a Section 1031 exchange consistent with IRS Revenue Ruling 2004-86. Tax counsel has provided a 'should'-level tax opinion to that effect. The DST wrapper lets exchangers defer capital gains while stepping into passive, net-leased, professionally managed healthcare real estate at a $50,000 minimum, receiving pro-rata cash distributions and pass-through depreciation without active-management or lender-recourse obligations. On exit, in addition to a conventional sale, the sponsor may offer an optional Section 721 UPREIT contribution, allowing investors to elect operating-partnership units on a tax-deferred basis or take cash. The memorandum stresses that 1031 qualification depends on each investor's own facts, that reserves and certain closing costs may create taxable boot, and that a Section 721 exchange is not guaranteed to be available.
Analysis of HPA Exchange - Vital Medical Dallas TX DST
Insights
For a 1031 exchanger, this offering trades the higher volatility of multifamily or ground-up development for the defensiveness of a long, absolute-net, corporately guaranteed healthcare lease - but concentrates that safety in a single specialized asset with a single operator, so diligence should center on tenant credit and healthcare fundamentals more than real-estate cyclicality. The economics are a moderate-yield, moderate-leverage profile: a roughly 5.35% year-one and 5.40% average distribution on a leveraged basis, supported by in-place sublease base rent of about $1.12 million (near $12.87 per square foot) growing 2.5% annually, against an effective fixed debt cost of 5.699%. Because the borrowing rate sits above the initial cash yield, the deal relies on rent escalations, principal paydown after the four-year interest-only period, and cap-rate stability at exit to generate total return; investors should model what happens if the exit cap rate widens from the entry basis, since the $19,920,000 total investment cost already exceeds the $17,300,000 appraised value - a meaningful load-and-basis spread that must be earned back before profit. The single most important variable to watch is the operating tenant: Nexus Children's Hospital - Dallas and its guarantor Nexus Health Systems drive 100% of income, and their solvency hinges on patient volumes and Medicaid or Medicare reimbursement, areas exposed to policy risk the sponsor cannot control. A tenant default would cascade through the affiliated master tenant to the Trust and could force a Springing LLC conversion that jeopardizes the very 1031 treatment investors sought. Structurally, the affiliated master tenant and sponsor-controlled trustee create conflicts of interest, and the fee load (11.31% selling costs, a 3% acquisition fee, a $450,000 affiliate bridge-loan fee, and 2% asset-management and 2% disposition fees) is on the higher side and dilutes net equity working in the real estate. Compared with a diversified net-lease DST holding many tenants across sectors, this is a concentrated, higher-conviction bet on one Dallas healthcare property; compared with an all-cash DST, the leverage amplifies both yield and downside. It fits an accredited investor with adequate liquidity elsewhere, a genuine need for 1031 deferral, comfort with healthcare-operator and single-asset risk, and a three-to-five-year horizon who values the optional Section 721 UPREIT exit as a potential route to further deferral or diversification - while recognizing that the exit, like the distributions and the tax outcome, is projected rather than guaranteed.
Advantages
The property is 100% leased under an absolute triple-net sublease to an operating children's hospital, with the tenant responsible for taxes, insurance, utilities, maintenance, and structural repairs, and the lease backed by a corporate guaranty from Nexus Health Systems, Inc. Contractual 2.5% annual rent escalations run through March 2038 and into renewal terms, providing built-in income growth. The sponsor targets a non-guaranteed first-year distribution of about 5.35% and an average near 5.40% over the loan term, paid quarterly until the offering is fully raised and monthly thereafter. Financing is conservative relative to appraised value, nonrecourse to investors, and - through an interest-rate hedge - fixed at an effective 5.699%, eliminating floating-rate risk despite the SOFR-based note, with four years of interest-only payments supporting early cash flow. The DST structure delivers genuinely passive ownership: investors hold beneficial interests, owe no management duties, and are not personally liable on the loan, while still qualifying for Section 1031 tax deferral under Revenue Ruling 2004-86 with a supporting tax opinion. The building is modern (renovated in 2022), in good physical condition with minimal near-term capital needs, sits in the large, growing, comparatively affluent Dallas MSA, and benefits from healthcare demand tailwinds. Reserves ($383,160 lender-held plus roughly $50,000 at the master tenant) add cushion, the targeted three-to-five-year hold is defined, and an optional Section 721 UPREIT exit gives investors a potential path to continued deferral or liquidity beyond a straight sale.
Concerns
This is a highly illiquid, speculative investment with no public market; investors must be prepared to hold for an indefinite period and could lose their entire investment. As DST beneficial owners they have no voting rights and no control over management, financing, or the timing of a sale - the signatory trustee, a sponsor affiliate, decides unilaterally - and a trustee can be removed only for willful misconduct, fraud, or gross negligence. The offering is single-asset and single-tenant: all income depends on one children's hospital operated by Nexus Children's Hospital - Dallas, LLC, so a decline in patient volume, a licensing or regulatory problem, a Medicaid or Medicare reimbursement cut, or a tenant bankruptcy could halt rent and distributions. The property is a specialized medical facility subject to extensive healthcare regulation, licensing, litigation exposure, and competition from nearby facilities, some potentially affiliated with the sponsor. The offering is leveraged (about 51.46% DST LTV, roughly 59.25% of appraised value) with a balloon maturity in August 2032; a payment default could trigger foreclosure and adverse tax consequences. Fees and load are significant: total selling commissions and expenses reach 11.31% of equity, plus a $513,000 acquisition fee, a $450,000 bridge-loan fee to a sponsor affiliate, ongoing asset-management and accounting fees, and a 2% disposition fee - and the total investment cost of $19,920,000 exceeds the $17,300,000 appraised value. Distributions are not guaranteed and may be paid from reserves or other sources, effectively returning capital. This is only the sponsor's second offering, conducted on a best-efforts basis with no minimum raise. Tax benefits are not assured - reserves and closing costs may create taxable boot, part of the going-concern value may be non-like-kind personal or intangible property, and a conversion to a 'Springing LLC' would forfeit future 1031 treatment.
HPA Exchange - Vital Medical Dallas TX DST — Complete Offering Data
Offering & Structure
Investment NameHPA Exchange - Vital Medical Dallas TX DST
SponsorHPA Exchange
StructureDelaware Statutory Trust (DST)
Offering Type506(c)
StatusClosed
Last Updated2026-07-13
Size & Availability
Total Offering$19,920,000
Equity$9,670,000
Debt$10,250,000
Available Equity$9,670,000 (0% of equity)
Minimum Investment$50,000
Total Load16.62%
Initial Reserves6.13%
Property
Property TypeMedical Office
StrategyCore
LocationTX
Market TierTier 1
Income & Projections
Average Yield6.02%
Projected Yields (Y1–Y10)Y1 6.04% · Y2 6.31% · Y3 6.59% · Y4 6.92% · Y5 5.32% · Y6 5.31% · Y7 5.64%
Tax-Adjusted Yield12.88%
Cap Rate Equivalent9.29%
Year 1 NOI$1,157,775
Y1 Payout Ratio0.98
Financing
In-Place LTV51.46% LTV
LenderNot Disclosed
Loan TypeFixed
Interest Rate5.699% (Fixed via hedge)
Loan TermNot Disclosed
I/O PeriodNot Disclosed
AmortizationNot Disclosed
Y1 DSCRNot Disclosed
Exit
Estimated Hold Period10 years
721 Exchange ExitOptional
Benchmarks (vs sector median)
Avg. Income6.02% vs 6.02% market — Meets Average
Growth14.57% vs 14.57% market — Meets Average
Peak6.92% vs 6.92% market — Meets Average
Every data point Baker 1031 tracks for this offering, in one place. Figures are drawn from the offering’s private placement memorandum and sponsor materials unless noted, are summaries for convenience only, and are qualified in their entirety by the PPM. Tap the ⓘ icon next to any label for what it means and how it is calculated.