Inland Long Island Residential DST Overview
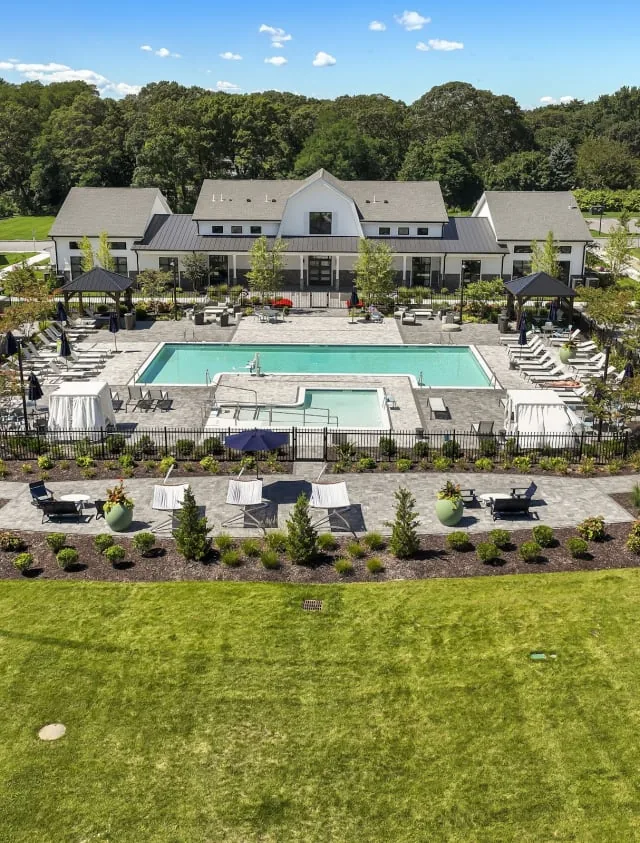
Inland Long Island Residential DST is a Delaware statutory trust sponsored by an affiliate of Inland Private Capital Corporation (IPC) that is offering $107,581,888 of beneficial interests to accredited investors, representing 100% of the trust. The trust owns The Arboretum, a newly built, Class A build-to-rent multifamily community located at 20 Maple Lane in Farmingville, New York, within Suffolk County on central Long Island and part of the greater New York metropolitan statistical area. Completed in 2023 and 2024, the property spans approximately 61.587 acres and comprises 76 residential buildings, a mix of single-family garden-style homes, stacked flats, and two- and three-bedroom townhomes, totaling 292 dwelling units (227 two-bedroom and 65 three-bedroom) and roughly 491,071 square feet of net leasable area. Thirty units are designated affordable housing under state and municipal requirements. Amenities include a clubhouse with fitness center, coworking space and pet spa, two swimming pools, pickleball and tennis courts, bocce courts, a putting green, a dog park, and a playground. As of January 19, 2026, the community was approximately 93.15% leased to residents. The trust acquired the property on January 30, 2026 for a purchase price of $190,000,000, funding it with offering equity and a $104,500,000 first-mortgage loan from PNC Bank. Consistent with the DST structure, the property is master-leased to an IPC affiliate, and investors hold passive beneficial interests with no management authority or voting rights in order to preserve Section 1031 exchange treatment under Revenue Ruling 2004-86. The offering is designed primarily for 1031 exchange investors (minimum $100,000) seeking to defer capital gains, as well as cash investors (minimum $25,000), who want passive, professionally managed exposure to a modern Long Island rental community. It suits investors with adequate financial means who desire a relatively long-term, illiquid hold and can bear the risk of loss.
Highlights
The Arboretum sits in Farmingville, a hamlet in the Town of Brookhaven in Suffolk County, on central Long Island and within the New York metropolitan statistical area, one of the largest and most supply-constrained housing markets in the country. According to the appraisal cited in the memorandum, median household income in the New York MSA is $101,061, roughly 17.86% above the New York state median and 39.20% above the national median. Within a five-mile radius of the property, approximately 74.95% of housing units are owner-occupied, well above the MSA average of 48.82%, and the surrounding housing stock is comparatively newer, signaling an established, higher-income residential submarket. The share of college graduates in the MSA exceeds the national average, and the appraisal characterizes the local employment base as diverse and stable with adequate access to employment centers, retail and public transportation. High for-sale housing costs and limited new supply on Long Island support ongoing rental demand, positioning a newly built build-to-rent community to draw households that want modern housing without the cost of ownership.
The Arboretum is a recently completed, Class A build-to-rent community constructed in 2023 and 2024, giving the trust a modern asset with limited near-term capital needs. The property condition assessment described the community as well-maintained and in good overall condition, with immediate repair needs estimated at only $531,050 against a $190,000,000 purchase price. The 292 units are spread across 76 low-density residential buildings, single-family garden-style homes, stacked flats, and two- and three-bedroom townhomes, offering a housing profile closer to for-sale product than to conventional apartments. Residents have access to an extensive amenity package: a clubhouse with leasing offices, fitness center, conference and coworking space, private dining room, lounge and pet spa; two swimming pools; pickleball, tennis, and bocce courts; a putting green; a dog park; a playground; and 384 parking spaces plus attached garages serving the townhomes and garden-style homes. As of January 19, 2026, the community was approximately 93.15% sub-leased to residents, demonstrating strong early leasing traction at a newly delivered asset.
The trust financed the acquisition with a $104,500,000 first-mortgage loan from PNC Bank, National Association, representing approximately 55% of the $190,000,000 purchase price and roughly 49% of total capitalization of $212,081,888; each $100,000 interest carries an allocated loan balance of $97,135.31. The loan has a seven-year initial term that automatically extends by one additional three-year term if certain conditions are met, providing a potential ten-year runway. Although the loan bears a floating rate of Daily Simple SOFR plus 1.25%, the trust has hedged its interest-rate exposure: an interest-rate cap holds the effective rate at no more than 4.30% through February 2027, 4.50% through February 2028, and 4.90% through June 2029, after which a forward interest-rate swap fixes the rate at 5.382% through January 2036. The loan is nonrecourse to investors, and it may be prepaid without premium or penalty apart from hedge break-funding costs, giving the sponsor flexibility on the timing of an eventual sale. The trust also funded $3,200,000 of reserves at closing.
The offering is sponsored by Inland Private Capital Corporation, part of The Inland Real Estate Group of Companies, one of the nation's largest commercial real estate and finance organizations with more than 50 years of operating history. As of September 30, 2025, IPC had sponsored 328 private placement programs that raised approximately $11 billion in equity from more than 28,500 investors. Across the broader Inland organization, as of December 31, 2024, Inland had raised more than $30.4 billion from over 490,000 investors and managed assets valued at approximately $16 billion, including 19,996 multifamily units across 42 states. Inland had sponsored 844 programs and completed 661 of them, including 146 Section 1031 exchange programs, and completed 19 full-cycle 1031 programs in 2023 and 2024 alone. Its acquisition affiliate, IREA, has facilitated more than $50 billion of real estate purchases over the years. The trust's day-to-day asset and property management are handled by Inland affiliates, providing vertically integrated, institutional oversight.
The offering is structured to serve as replacement property for investors completing a like-kind exchange under Section 1031 of the Internal Revenue Code, allowing them to defer federal and state capital gains taxes on the sale of relinquished investment real estate. Special tax counsel has provided an opinion that an investor's acquisition of an interest should be treated as a direct acquisition of real estate for Section 1031 purposes, although the trust has not sought, and does not intend to seek, a private letter ruling from the IRS. Investors receive monthly cash distributions from available net cash flow, plus a pro rata share of any appreciation upon sale. The trust's business plan contemplates operating the property and ultimately selling it, at which point proceeds may be reinvested through a subsequent 1031 exchange to continue deferral. A Springing LLC mechanism exists to protect the property in distress scenarios; that conversion generally should not be taxable under Section 721, though gain on any later sale of Springing LLC units likely would not be deferrable.
Analysis of Inland Long Island Residential DST
Insights
Read past the marketing and this is a capital-preservation residential hold, not a yield or growth play: a newly delivered Long Island build-to-rent community bought at a sub-4.4% going-in yield, where the return case leans on gradual rent escalation, Inland's operating durability and a benign exit more than on current cash flow. On the sector screens it is squarely middle-of-the-pack, with average income, peak yield and projected growth all reading "Meets Average" for multifamily, so an exchanger is buying neither a bargain nor a stretch. The distribution opens at 4.35% and grinds to about 5.37% by year ten (roughly a 4.59% average), thin for a levered, still-leasing asset. Two figures deserve scrutiny. First, a Year-1 payout ratio near 1.16 means first-year distributions run about 16% above first-year NOI, so the 4.35% is not yet covered by property income and is partly funded from the $3.2M closing reserve, a routine lease-up bridge but a sign the headline yield is engineered rather than earned at the outset. Second, the load is heavy, roughly 13.33% all-in (about 8.40% of offering-level fees plus a 4.93% acquisition fee), lifting the offering price well above the $190M property cost and creating a spread appreciation must erase before an investor breaks even; you are paying for Inland's vertical integration and the rate hedge as much as for the real estate. That hedge is the genuinely investor-favorable feature, a cap holding the rate at or below 4.90% through mid-2029 and a forward swap fixing 5.382% into 2036, largely removing near-term rate risk, though it locks in a higher long-term coupon and unwind costs that could complicate an early sale. The outcome hinges on lease-up and exit: whether occupancy above the current ~93% and the appraisal's rent assumptions hold, whether coastal insurance, affordable-unit and PILOT costs track forecast, and above all where New York cap rates sit when the seven-to-ten-year loan balloons. Worth flagging what the growth story omits, that the same appraisal shows the New York MSA losing roughly 413 residents a year from 2020 to 2025, so demand rests on Long Island incomes, ownership costs and scarce supply, not population tailwinds. Even Inland's full-cycle record, 77 realized deals at about a 1.52x equity multiple and an 8% average annual return over roughly 6.9 years, frames this as single-digit, income-led total return rather than a home run. Versus a net-lease DST, the investor trades single-tenant credit risk for granular residential tenancy and active operations, gaining rent-growth optionality but taking on turnover and expense sensitivity. Best suited to exchangers wanting durable, tax-deferred residential income from an institutional sponsor who can accept illiquidity, single-asset concentration, roughly 55% leverage and DST loss of control; those who need fully NOI-covered current yield, portfolio diversification, or double-digit total returns should pass.
Advantages
Newly constructed, Class A build-to-rent community completed in 2023 and 2024, with the property assessment reporting good overall condition and modest immediate repair needs of $531,050, limiting near-term capital risk. Located on central Long Island within the high-income, supply-constrained New York MSA, where median household income of $101,061 runs well above state and national levels. Strong early performance, with the community approximately 93.15% sub-leased as of January 19, 2026. Sponsored by Inland Private Capital Corporation and the broader Inland organization, an experienced manager that had sponsored 328 IPC private placement programs raising roughly $11 billion, with 19,996 multifamily units under management and 19 full-cycle 1031 programs completed in 2023 and 2024. Moderate leverage of about 55% loan-to-purchase price, financed with a nonrecourse PNC loan whose floating rate is hedged by a cap and forward swap that fix the effective rate through the anticipated hold, mitigating near-term interest-rate risk. A master lease to an Inland affiliate provides operational flexibility, and monthly distributions are paid from net cash flow. The structure is designed for Section 1031 exchange investors, with a supporting tax opinion, and the property benefits from a New York PILOT program that can abate a portion of real estate taxes on new improvements, supporting net operating income.
Concerns
The interests are illiquid, with no public market and significant transfer restrictions; investors should expect to hold for an indefinite, long-term period and be able to bear a total loss. Under the DST structure and Revenue Ruling 2004-86, investors have no control over the trust and no voting rights, and the trustees have limited duties and authority. The investment is undiversified: a single build-to-rent asset in one location, so its performance depends entirely on one property and its market. The property carries a $104,500,000 loan; although hedged, the underlying rate is floating (SOFR plus 1.25%) and the hedges could prove ineffective, the loan matures with a balloon that must be repaid or refinanced, prepayment and hedge break-funding costs may constrain exit timing, and the loan documents contain restrictive covenants whose breach could trigger default and foreclosure. The trust depends on an affiliated master tenant, which in turn depends on residents paying rent; defaults would reduce cash flow. The property is in a hurricane-susceptible region, must maintain 30 affordable housing units at preset, income-restricted rents, and is subject to New York PILOT compliance obligations. The sponsor and its affiliates serve as master tenant, property manager, asset manager and placement agent, creating conflicts of interest, and compensation is not the result of arm's-length negotiation. Front-end load is substantial: roughly 8.40% in offering-level commissions and fees plus a 4.93% acquisition fee. Distributions are not guaranteed and depend on operations, and there are tax risks, including the possibility that the exchange may not qualify under Section 1031 or that exchange funds used for costs create taxable boot.
Inland Long Island Residential DST — Complete Offering Data
Offering & Structure
Investment NameInland Long Island Residential DST
SponsorInland
StructureDelaware Statutory Trust (DST)
Offering Type506(b)
StatusRejected
Last Updated2026-07-13
Size & Availability
Total Offering$212,081,888
Equity$107,581,888
Debt$104,500,000
Available Equity$107,581,888 (100% of equity)
Minimum Investment$100,000
Total Load13.33%
Initial Reserves2.97%
Property
Property TypeMultifamily
StrategyCore
LocationNY
Market TierTier 1
Income & Projections
Average Yield4.59%
Projected Yields (Y1–Y10)Y1 4.35% · Y2 4.35% · Y3 4.35% · Y4 4.35% · Y5 4.36% · Y6 4.44% · Y7 4.46% · Y8 4.77% · Y9 5.07% · Y10 5.37%
Tax-Adjusted Yield7.25%
Cap Rate Equivalent8.37%
Year 1 NOI$9,900,567
Y1 Payout Ratio1.16
Financing
In-Place LTV49.28% LTV
LenderPNC
Loan TypeVariable
Interest Rate4.30% cap year 1 / 5.382% swap
Loan Term7 years + 3-year extension
I/O Period7 years
Amortization30 years
Y1 DSCRNot Disclosed
Exit
Estimated Hold Period10 years
721 Exchange ExitOptional
Benchmarks (vs sector median)
Avg. Income4.59% vs 4.85% market — Meets Average
Growth23.45% vs 24.88% market — Meets Average
Peak5.37% vs 5.55% market — Meets Average
Every data point Baker 1031 tracks for this offering, in one place. Figures are drawn from the offering’s private placement memorandum and sponsor materials unless noted, are summaries for convenience only, and are qualified in their entirety by the PPM. Tap the ⓘ icon next to any label for what it means and how it is calculated.