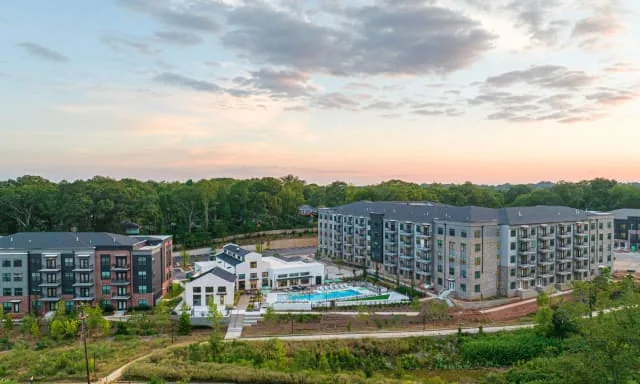
JWCM Vivian DST Overview
JWCM Vivian, DST is a Regulation D private placement offering 100% of the Class 1 Beneficial Interests in a newly formed Delaware statutory trust to accredited investors, with a maximum equity offering of $46,170,900. The trust owns "The Vivian," a mid-rise multifamily apartment community built in 2023 at 1246 Allene Avenue Southwest, Atlanta, Georgia 30310, in the Capitol View/Adair Park area of Southwest Atlanta directly on the completed Southwest trail of the Atlanta Beltline. The property spans approximately 8.471 acres and comprises 325 studio, one- and two-bedroom apartments (averaging 813 square feet) across three three-, four- and five-story buildings totaling roughly 264,136 net leasable square feet, plus one retail lease. Amenities include a swimming pool, fitness center, coffee shop, dog park, EV charging, a yoga room, clubhouse and Beltline access, and units feature granite counters, in-unit washer/dryers and private balconies. The property was acquired on August 21, 2025 for $81,500,000, capitalized with the $46,170,900 equity raise and a $47,189,000 Fannie Mae DUS loan from KeyBank, for a total capitalization of $93,359,900. The trust leases the property to an affiliated master tenant (JWCM Vivian Master Tenant, LLC) under a master lease, and the property is professionally managed. The sponsor's business plan targets mid-90% occupancy, organic rent growth on a recently stabilized asset, and a sale within approximately five to ten years, with monthly distributions estimated to begin at 5.31% annualized in Year 1 and projected to range from 4.44% to 5.96% annualized over Years 1 through 10. A distinguishing feature is a long-term Fulton County Development Authority property-tax abatement delivered through a bond-lease structure, and the property carries a Land Use Restriction Agreement requiring at least 15% of units be marketed as workforce/affordable housing. Structured for Section 1031 exchange investors (minimum $100,000 of equity) as well as cash investors (minimum $25,000), the offering suits accredited investors seeking passive, tax-deferred, income-oriented exposure to Sunbelt multifamily real estate who do not require liquidity or day-to-day control. The sponsor is JWCM Exchange I, LLC, an affiliate of New York-based Jesselson Warsavsky Capital Management (JWCM).
Highlights
The Vivian sits in the Capitol View/Adair Park area of Southwest Atlanta, directly on the fully completed Southwest trail of the Atlanta Beltline, which gives residents walkable connectivity to more than 400,000 square feet of retail, restaurants, breweries and coworking space and has been drawing younger, higher-income residents to a neighborhood where average home values now exceed $400,000. The property lies within the Atlanta-Sandy Springs-Roswell MSA, one of the largest regional economies in the United States with an estimated 2023 GDP of roughly $571 billion, anchored by a diversified base spanning logistics, fintech, healthcare, film production and higher education. Atlanta is home to 17 Fortune 500 headquarters, including Coca-Cola, Delta Air Lines, Home Depot, UPS and Southern Company, and to Hartsfield-Jackson, long ranked the world's busiest airport by passenger volume. Tourism draws roughly 50 million visitors a year, and the site offers convenient access to major employment, entertainment and education hubs across the region.
Built in 2023, The Vivian is an institutional-quality, mid-rise multifamily community that a third-party Property Condition Assessment rated "category 1," indicating new or like-new condition. Its 325 units are spread across a well-balanced mix of 37 studios (11.4%), 209 one-bedroom (64.3%) and 79 two-bedroom (24.3%) floor plans averaging 813 square feet, situated on 8.471 acres in three three-, four- and five-story buildings with 378 parking spaces. Community amenities include a swimming pool, fitness center, grilling area, on-site coffee shop, dog park, EV charging, meeting space and lounge, a yoga room and a clubhouse, plus direct Beltline access. Individual units feature central air-conditioning, granite countertops, shaker-style cabinetry, in-unit washer/dryers and private patios or balconies. The asset is recently stabilized, and the sponsor intends to maintain occupancy in the mid-90% range while funding roughly $465,000 of budgeted capital improvements to preserve the property's luxury standard and drive ancillary revenue.
The property was acquired for $81,500,000 against an "As Is" appraised value of $81,600,000 (Newmark, as of June 30, 2025), and capitalized with $46,170,900 of equity and a $47,189,000 first mortgage, for a total capitalization of $93,359,900. The loan was originated by KeyBank under the Fannie Mae Delegated Underwriting and Servicing (DUS) program, carries a 10-year term at a fixed 5.30% interest rate, and is non-recourse to the trust apart from customary carve-outs. Notably, the loan is interest-only for its first seven years, with principal-and-interest amortization beginning October 1, 2032 for the final three years, which supports cash flow during the early hold period. Leverage is moderate for the sector, at roughly 58% of the property's value and about 50% of total capitalization, and the fixed rate removes near-term interest-rate risk over the projected hold. The trust also funded reserves, including a $646,735 Supplemental Trust Reserve plus lender-required replacement, insurance and tax escrows.
The offering is sponsored by JWCM Exchange I, LLC, formed in 2022 and managed by Jesselson Warsavsky Capital Management (JWCM), a New York-based real estate investment firm founded in 2014 by Samuel Jesselson and Jason Warsavsky. Since inception, JWCM reports having raised more than $350 million in equity from over 200 investors and currently has more than 3,000 multifamily units under management or in development. JWCM Vivian, DST is the third Delaware statutory trust program sponsored by JWCM Exchange. The leadership team brings institutional pedigrees: Mr. Jesselson previously executed over $1 billion of transactions at C-III Capital Partners and worked at Island Capital Group and Lehman Brothers; Mr. Warsavsky came from Pegasus Capital Advisors, Moelis & Company and Lehman's real estate private equity group; and senior members add asset-management experience from RXR, Atlas Capital Group and Two Sigma Real Estate. Day-to-day operations are handled by an institutional third-party property manager, with the trust managed by JWCM Vivian Manager, LLC.
The offering is designed for Section 1031 exchange investors seeking to defer federal and state capital gains taxes, with a minimum 1031 investment of $100,000 of equity (and $102,205 of deemed debt); cash investors may participate at $25,000. Tax counsel has provided an opinion (Exhibit D) that a purchaser's acquisition of an Interest should be treated as a direct acquisition of an interest in real property for Section 1031 purposes, though no IRS private letter ruling has been sought. A signature benefit is the long-term Fulton County Development Authority property-tax abatement, delivered through a proven bond-lease structure that provides roughly 50% real-estate-tax savings in year one, declining 5% annually thereafter, materially enhancing net operating income. Monthly distributions are projected to be partially sheltered by depreciation and amortization. The trust also offers a potential future liquidity path: after a minimum two-year hold, the manager may exercise an Exchange Right to convert Interests into units of an affiliated entity, which are anticipated to later be exchangeable for REIT shares on a tax-deferred basis under Section 721.
Analysis of JWCM Vivian DST
Insights
JWCM Vivian reads less like core Atlanta multifamily than a subsidy-and-structure carry trade: the buyer really underwrites a Fulton County property-tax abatement and a seven-year interest-only window wrapped around a new (2023), 325-unit Beltline asset; whether rent growth arrives before those props fade is the whole game. The numbers are honest but unspectacular. The 5.31% Year 1 and 5.25% ten-year-average distributions clear the ~4.85% income benchmark (Meets Average) and the 5.96% Year 3 peak edges the 5.55% peak benchmark (also Meets), but growth screens Below Average - the tell: the stream peaks in Year 3, then grinds to a 4.44% Year 8 trough as the abatement steps off 5% a year and amortization starts October 2032. The load is heavy - 12.05% all-in plus a 2.75% acquisition fee - so barely four of five dollars reach real estate, and at ~51% leverage the early yield leans on the interest-only window and ~50% first-year tax break, not fully-taxed, fully-amortizing NOI; covered, but structurally flattered, not organically earned. The crux is the exit: at half debt, the thesis hinges on selling into a stable-or-better cap-rate market in five to ten years and holding mid-90s occupancy - watch Capitol View rents and the terminal cap. What the deck buries: JWCM has raised $350M-plus, but this is only its third DST with no full-cycle track record, so you're underwriting its promise on exits, not results; the master tenant is backstopped by a mere $2.4M demand note. Add a leasehold bond-lease title, a remediated battery-plant Brownfield, and a 20-year affordable set-aside: no plain-vanilla DST. Verdict: fair for the 1031 exchanger who wants Sunbelt multifamily, values the optional Section 721 UPREIT off-ramp, and can stomach the load and an unproven sponsor; pass if you need a growing distribution, clean fee-title ownership, or a sponsor with realized full-cycle numbers.
Advantages
JWCM Vivian offers accredited and 1031-exchange investors a passive, income-oriented interest in a newly built (2023), institutionally maintained "category 1" apartment community in a growing Sunbelt market, without landlord responsibilities. The asset is recently stabilized in the amenity-rich Beltline corridor of Southwest Atlanta, a submarket benefiting from significant reinvestment and rising home values. The capital structure is conservative and de-risked on rate: a fixed 5.30%, non-recourse Fannie Mae DUS loan with seven years of interest-only payments supports early-period cash flow, and moderate leverage (roughly 58% of value) limits refinancing pressure over the projected five-to-ten-year hold. Projected monthly distributions begin at an estimated 5.31% annualized in Year 1 (projected 4.44%-5.96% across Years 1-10) and are expected to be partially tax-deferred through depreciation and amortization. A standout economic driver is the long-term Fulton County Development Authority tax abatement, a bond-lease structure used in Atlanta for more than a decade that delivers about 50% property-tax savings in year one, tapering 5% per year, meaningfully boosting net cash flow versus a fully taxed comparable. The purchase price of $81.5 million came in slightly below the $81.6 million "As Is" appraisal and included a $250,000 seller credit. The sponsor, JWCM, is an experienced operator that has raised over $350 million from more than 200 investors with 3,000-plus multifamily units under management, and it applies a downside-focused underwriting philosophy. The DST wrapper enables clean 1031 deferral with a low $100,000 minimum for exchangers, and a Section 721 UPREIT exchange option offers a potential future path into REIT shares after the two-year hold.
Concerns
As with any DST, the risks are real and specific. The Interests are illiquid with no public market, and beneficial owners have no voting rights and no control over management, operations, or the timing of a sale; the manager cannot practically be removed because the lender requires an adequately capitalized successor. This is a single-asset, undiversified investment concentrated in one Atlanta submarket, so occupancy, rent, tax, or casualty problems at The Vivian directly impair returns. The offering is a "best efforts" raise with no minimum and no escrow, and the sales load is heavy, at up to 12.05% of total sales in commissions and fees plus a $2,241,250 (2.75%) sponsor acquisition fee, creating a meaningful gap between capital invested and equity deployed into real estate. The trust leases the property to an affiliated master tenant, and distributions depend on that master tenant's performance; the master tenant is capitalized only by a $2,400,000 sponsor Demand Note that may prove insufficient, and it holds a limited right to defer rent. The trust does not hold fee title: the land and improvements are owned by the Development Authority under the bond-lease, and the trust holds only a leasehold it is obligated to purchase later, adding structure and Section 1031 complexity flagged by tax counsel. The tax abatement declines each year and eventually burns off, and a Land Use Restriction Agreement requires at least 15% of units be rented as affordable (at or below 80% AMI) for 20 years, which can cap revenue. The site is a remediated Brownfield, formerly a lead-acid battery plant, relying on engineering and institutional controls including a vapor-intrusion mitigation system, groundwater-use restrictions and ongoing monitoring. The loan carries amortization/balloon risk (principal and interest begin in 2032, with a balloon at the 10-year maturity), the trust cannot refinance or raise new capital while a DST, and 1031 treatment rests on a limited tax opinion rather than an IRS ruling.
JWCM Vivian DST — Complete Offering Data
Offering & Structure
Investment NameJWCM Vivian DST
SponsorJWCM
StructureDelaware Statutory Trust (DST)
StatusAvailable
Last Updated2026-08-17
Size & Availability
Total Offering$93,359,900
Equity$46,170,900
Debt$47,189,000
Available Equity$19,054,432 (41.3% of equity)
Minimum Investment$100,000
Total Load12.05%
Initial Reserves0.69%
Property
Property TypeMultifamily
StrategyCore-Plus
LocationGA
Market TierTier 1
Income & Projections
Average Yield5.25%
Projected Yields (Y1–Y10)Y1 5.31% · Y2 5.60% · Y3 5.96% · Y4 5.76% · Y5 5.21% · Y6 5.15% · Y7 5.37% · Y8 4.44% · Y9 4.69% · Y10 5.03%
Tax-Adjusted Yield6.80%
Cap Rate Equivalent8.90%
Financing
In-Place LTV50.55% LTV
LenderKeyBank National Association
Loan TypeFixed
Interest Rate5.30% (Fixed)
Loan Term10 years
I/O Period7 years
Amortization30 years
Y1 DSCR1.99x
Exit
Estimated Hold Period10 years
721 Exchange ExitOptional
Benchmarks (vs sector median)
Avg. Income5.25% vs 4.85% market — Meets Average
Growth12.24% vs 24.88% market — Below Average
Peak5.96% vs 5.55% market — Meets Average
Every data point Baker 1031 tracks for this offering, in one place. Figures are drawn from the offering’s private placement memorandum and sponsor materials unless noted, are summaries for convenience only, and are qualified in their entirety by the PPM. Tap the ⓘ icon next to any label for what it means and how it is calculated.