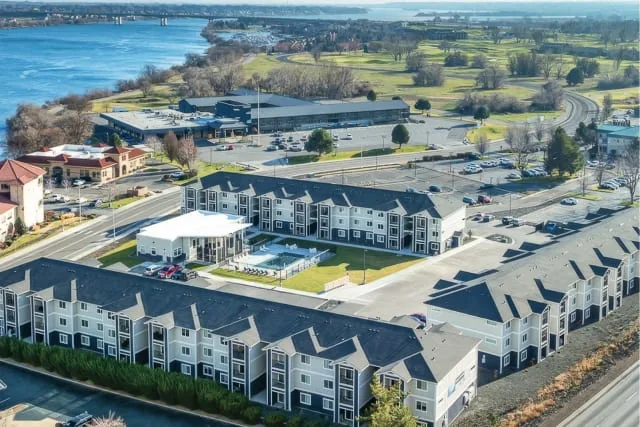
Starboard Bradley DST Overview
Starboard Bradley DST offers accredited investors the opportunity to acquire beneficial interests in a newly formed Delaware statutory trust that owns The Banks on Bradley, a Class A, garden-style, low-rise apartment community completed in 2024 and located at 355 Bradley Boulevard, Richland, Washington 99352. The property comprises 144 units across three three-story residential buildings plus a clubhouse and leasing office, totaling approximately 105,516 net rentable square feet on roughly 4.56 acres, with 217 parking spaces. The unit mix consists of 12 studios, 72 one-bedroom units, and 60 two-bedroom units, averaging 733 square feet. As of the February 2, 2026 rent roll, the property was 88.9% occupied while still in the latter stages of lease-up. The Trust acquired the asset on November 26, 2025 from a Sponsor affiliate and has master-leased the entire property to Starboard Bradley MT LLC, a wholly owned Sponsor subsidiary, which in turn subleases units to residents. The property sits within the Kennewick-Richland (Tri-Cities) MSA in Benton County, directly across from the Columbia River near Richland's city center, with an economy anchored by healthcare (Kadlec Regional Medical Center), the federally funded Hanford Site cleanup, engineering and energy employers such as Bechtel and Energy Northwest, and Washington State University Tri-Cities. The maximum equity offering is $22,570,000, paired with a $19,298,000 Freddie Mac fixed-rate loan for a total capitalization of $41,868,000 and a loan-to-value of 46.09%. The Trust is sponsored by Starboard Realty Advisors, LLC of Irvine, California. Structured for Section 1031 exchange investors seeking to defer capital gains, the offering is designed for accredited investors who want passive, professionally managed multifamily real estate, can accept illiquidity and a lack of day-to-day control, and desire a relatively long-term hold. Minimum investment is $100,000 for 1031 investors and $25,000 for cash investors.
Highlights
The property is located in the Kennewick-Richland (Tri-Cities) MSA, an economically diversified Eastern Washington market. According to data cited in the Memorandum, the metropolitan area had a 2024 population of roughly 322,554 and grew about 19.85% between the 2010 and 2020 censuses, with continued projected annual growth of approximately 1.0% to 1.4%. The 2024 median household income of $87,523 runs 10.69% above the national figure of $79,068 and is projected to reach $102,167 by 2029, while the area's cost-of-living index of 98.2 sits modestly below the national average. The regional economy is supported by the federally funded Hanford Site cleanup under the legally binding Tri-Party Agreement, Kadlec Regional Medical Center, Bechtel, Energy Northwest, ConAgra/Lamb-Weston, and Washington State University Tri-Cities, lending the renter base relative employment stability.
The Banks on Bradley is a recently constructed, Class A garden-style community completed in 2024, reducing near-term capital expenditure risk relative to older assets. Its 144 units span studios and one- and two-bedroom floor plans averaging 733 square feet, with interiors featuring quartz countertops, wood cabinetry, stainless steel appliances, faux-wood flooring, in-unit laundry, pantry/linen closets, select walk-in closets, and patios or balconies with storage. Community amenities include a clubhouse, swimming pool, barbecue and picnic area, conference room, fitness center, pet spa, and on-site leasing office. The location is a differentiator: the property sits directly across from the Columbia River near Howard Amon Park, and is close to Kadlec Regional Medical Center plus highly rated public schools (Lewis and Clark Elementary and Richland High). As of February 2, 2026 the property was 88.9% occupied and still stabilizing.
The Trust financed the acquisition with a $19,298,000 loan from KeyBank National Association under the Freddie Mac Conventional Fixed Rate Program, subsequently assigned to Freddie Mac with KeyBank continuing to service it. The loan carries a fixed interest rate of 5.11% per annum and an approximately 10-year term maturing December 1, 2035, providing rate certainty across the hold and insulating the Trust from near-term interest-rate volatility. The structure is interest-only for roughly the first seven years (through January 1, 2033) before amortizing over the final three years, which supports current distributions during the early hold. At $19,298,000 of debt against a total capitalization of $41,868,000, the loan-to-value is a conservative 46.09%, with equity of $22,570,000 representing 53.91% of the capital stack. The comparatively modest leverage lowers refinancing and balloon exposure versus more highly levered DST offerings.
The offering is sponsored by Starboard Realty Advisors, LLC, a Delaware limited liability company headquartered at 19100 Von Karman Avenue, Irvine, California, and wholly owned and controlled by principals William H. Winn Jr. and Steven J. Carlton. Starboard affiliates fill each operating role in the structure: Starboard Bradley MT LLC serves as Master Tenant and day-to-day operator, Starboard Bradley Depositor LLC as Depositor, and Starboard Bradley Manager LLC as Administrative Trustee responsible for the Trust's operation. The Sponsor and its affiliates provide meaningful backstops, including a $250,000 Master Tenant Demand Note, a full guaranty of the Bridge Capital used to warehouse the property, and a guaranty of the loan's non-recourse carve-outs by William H. Winn Jr. as Guarantor. This alignment concentrates operational responsibility, and investors should note the Memorandum does not detail an extensive quantified prior-program track record.
The offering is structured specifically for Section 1031 exchange investors seeking to defer federal and state capital gains taxes by exchanging relinquished property for a like-kind interest in the Trust. Because the investment is a Delaware statutory trust interest, tax counsel has provided an opinion that an investor's acquisition of an interest should be treated as a direct acquisition of real property for Section 1031 purposes, though the Trust has not sought and does not plan to seek an IRS ruling, and the opinion is limited in scope. Investors may also benefit from depreciation and potential future deferral if sale proceeds are reinvested in another exchange. The stated business objective is to hold the property and complete a sale prior to the loan's maturity to maximize return of capital; note that this offering contemplates an outright sale exit and does not describe a Section 721 UPREIT or fair-market-value roll-up option. The minimum 1031 investment is $100,000.
Analysis of Starboard Bradley DST
Insights
Starboard Bradley DST is best read not as a stabilized multifamily coupon but as a levered lease-up bet in a Master-Lease wrapper: a 2024-vintage, Class A Richland asset still climbing toward stabilization, where the Year-1 distribution is engineered by a Sponsor-affiliate lease structure rather than yet earned by the property. On relative value it screens as squarely average, not cheap: the ~4.92% average yield and 4.43% first-year distribution ramping toward 5.54% by Year 7 essentially match the multifamily market, with average income, peak yield, and growth all flagging Meets Average, so investors collect a market rate for above-market execution risk. Two things temper that coupon. The all-in load is heavy at roughly 20.8% (about 10.5% upfront syndication, leaving ~89.5% for real estate, the rest a Sponsor acquisition fee near $528,138 plus $600,000 at closing and a 2.0%-4.0% disposition fee), and the Year-1 payout ratio of 1.01x means distributions slightly exceed in-place NOI, propped by reserves rather than fully covered, a direct read-through of the 88.9% February 2026 occupancy. The crux is lease-up versus underwriting: the first building did not reach 92% until July 2025, so absorption is real but unfinished, and the Additional/Bonus Rent minimums ($995,051 in Lease Year 1, $998,617 in Year 2) are what actually fund investor cash flow. Watch occupancy, and watch the January 2033 interest-only cliff, when amortization pulls the projected Year-8 yield back to ~4.67%. What the marketing underplays: unlike a net-lease, credit-tenant DST, distributions ride on a newly formed, thinly capitalized affiliate Master Tenant (a $250,000 Demand Note, not guaranteed), and the Sponsor's record is modest, four full-cycle deals averaging a 1.35x equity multiple and roughly 6.3% annual return over about six years, so you are underwriting execution from a limited record with every operating role affiliate-controlled. The 46.09% LTV and fixed 5.11% coupon genuinely de-risk the balloon, but leverage this light also caps upside, so the heavy load buys a low-octane, average-yield hold. It fits a 1031 exchanger who wants a newer asset, moderate leverage, and passive income and can accept single-asset concentration, affiliate reliance, and a long hold ending in a straight sale with no Section 721 option. It is the wrong deal for anyone needing contractual credit-tenant income, a light load, near-term liquidity, or a distribution covered by property income on day one.
Advantages
Several features distinguish this offering. First, the asset is new: The Banks on Bradley was completed in 2024, which should limit deferred maintenance and near-term capital expenditures compared with older multifamily assets, and the Trust funded $1,300,000 of Trust Reserves plus lender and master-tenant reserves at closing. Second, leverage is conservative at 46.09% LTV with a fixed 5.11% rate locked for roughly ten years to December 1, 2035, reducing interest-rate and refinancing pressure during the hold, and an initial interest-only period (through January 2033) that supports current cash flow. Third, the Kennewick-Richland market offers above-average median household income ($87,523, about 10.69% over the national figure), historically strong population growth, and an economy anchored by the federally funded Hanford Site cleanup, Kadlec Regional Medical Center, Bechtel, and Energy Northwest, which lends the tenant base relative stability. Fourth, the location is genuinely amenity-rich, sitting across from the Columbia River and Howard Amon Park and near highly rated schools. Fifth, the Delaware statutory trust structure is purpose-built for Section 1031 exchangers, with a supporting tax opinion, a low $100,000 minimum, fully passive management, and Sponsor-affiliate backstops including a Master Tenant Demand Note and a guaranty of the Bridge Capital. For an exchange investor prioritizing a newer asset, moderate leverage, and hands-off ownership, these are meaningful advantages.
Concerns
The Memorandum discloses substantial risks. The interests are illiquid with no public market and heavy transfer restrictions, so investors must be prepared to hold long-term and could lose their entire investment. As DST beneficiaries, investors have no control: the Administrative Trustee alone manages the Trust and decides whether and when to sell, investors cannot participate in decisions, and trustees can be removed only by a majority of interests and only for willful misconduct, fraud, or gross negligence. Delaware law imposes no fiduciary duty beyond an implied duty of good faith. The so-called seven deadly sins restrict the Trust from renegotiating the loan or leases or raising new capital; if trouble arises, the Trust may convert to a Springing LLC, which can jeopardize Section 1031 treatment. This is a single, undiversified asset concentrated in one submarket, and the regional economy is materially dependent on federal Hanford Site funding that could change. Occupancy was only 88.9% as of February 2026 and the property is still in lease-up, so projected distributions may not be achieved. Distributions depend on the Sponsor-affiliated Master Tenant paying rent; the Master Tenant is newly formed and thinly capitalized (a $250,000 Demand Note), and payments are not guaranteed. The offering carries a meaningful load: total syndication costs of 10.50% of equity leave roughly 89.50% for real estate, plus a Sponsor acquisition fee of $528,138 (with $600,000 more paid at closing) and a 2.0%-to-4.0% disposition fee. Leverage adds balloon/refinancing risk at maturity, and Section 1031 qualification rests on a limited tax opinion, not an IRS ruling. Numerous conflicts of interest exist because affiliates control every role.
Starboard Bradley DST — Complete Offering Data
Offering & Structure
Investment NameStarboard Bradley DST
SponsorStarboard Realty Advisors
StructureDelaware Statutory Trust (DST)
Offering Type506(c)
StatusRejected
Last Updated2026-05-20
Size & Availability
Total Offering$41,868,000
Equity$22,570,000
Debt$19,298,000
Available Equity$21,810,005 (96.6% of equity)
Minimum Investment$100,000
Total Load20.77%
Initial Reserves7.20%
Property
Property TypeMultifamily
StrategyCore-Plus
LocationWA
Market TierTier 3
Income & Projections
Average Yield4.92%
Projected Yields (Y1–Y10)Y1 4.43% · Y2 4.45% · Y3 4.67% · Y4 4.91% · Y5 5.12% · Y6 5.34% · Y7 5.54% · Y8 4.67% · Y9 4.94% · Y10 5.17%
Tax-Adjusted Yield11.27%
Cap Rate Equivalent8.32%
Year 1 NOI$1,998,745
Y1 Payout Ratio1.01
Financing
In-Place LTV46.09% LTV
LenderKeyBank, National Association
Loan TypeFixed
Interest Rate5.11% (Fixed)
Loan Term10 years
I/O Period7 years
Amortization30 years
Y1 DSCR2.00x
Exit
Estimated Hold Period10 years
721 Exchange ExitNone
Benchmarks (vs sector median)
Avg. Income4.92% vs 4.85% market — Meets Average
Growth25.06% vs 24.88% market — Meets Average
Peak5.54% vs 5.55% market — Meets Average
Every data point Baker 1031 tracks for this offering, in one place. Figures are drawn from the offering’s private placement memorandum and sponsor materials unless noted, are summaries for convenience only, and are qualified in their entirety by the PPM. Tap the ⓘ icon next to any label for what it means and how it is calculated.